


Value of multiple quantitative dual-energy CT parameters combined with conventional CT signs to identify benign and malignant primary epithelial tumors of the ovary
-
摘要:
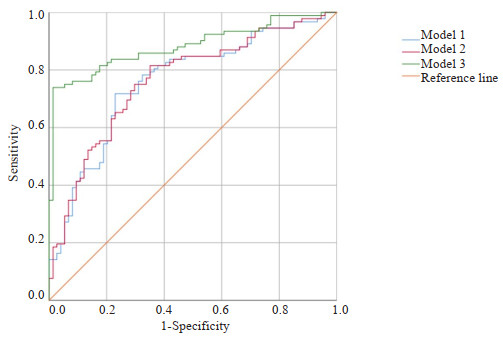
目的 探究双能量CT多定量参数联合常规CT征象鉴别卵巢原发上皮性肿瘤良恶性的临床应用价值。 方法 回顾性连续收集2021年1月~2023年6月盐城市第一人民医院166例经手术证实的卵巢原发上皮性肿瘤病例,所有患者术前2周内均行能谱CT增强扫描,根据术后病理分为良性组(n=74)和恶性组(n=92)。记录患者的一般临床特点及常规CT特征。由2位观察者分别独立测量病灶相关双能量CT定量参数:动脉期、静脉期碘浓度,计算标准化碘浓度,测量40、50、60、70、80、90 keV单能量CT值,计算动脉期、静脉期能谱曲线斜率(K40-90 keV)。采用组内相关系数检测2位测量者测量参数之间的一致性。比较两组之间各参数的差异,筛选出P < 0.1的变量作为输入变量,逐步建立基于常规CT征象、双能量CT定量参数及两者联合的二元Logistic回归模型。采用ROC曲线比较3个模型鉴别卵巢上皮性肿瘤良恶性的诊断效能。采用DeLong检验比较各曲线下面积的差异。 结果 2位测量者对动脉期、静脉期两组间测得的各参数一致性较好,组内相关系数均大于0.75。良性组与恶性组的一般临床特点(年龄、临床症状)、8个常规CT征象(肿瘤位置、肿瘤形态、肿瘤边界、肿瘤密度、腹水、是否伴腹膜/网膜转移、膈上淋巴结、其他脏器转移)与双能量CT各定量参数(动脉期及静脉期CT40 keV、CT50 keV、CT60 keV、CT70 keV、CT80 keV、CT90 keV、K40-90 keV、碘浓度、标准化碘浓度)差异有统计学意义(P < 0.05)。基于常规CT征象、双能量CT定量参数及两者联合的二元Logistic回归模型的曲线下面积依次为0.760、0.764、0.883。经DeLong检验,基于常规CT征象的模型和基于双能量CT定量参数模型之间曲线下面积的差异无统计学意义(Z=-0.659, P=0.510),基于常规CT征象的模型和基于两者联合的模型之间曲线下面积的差异有统计学意义(Z=-4.007, P < 0.001),基于双能量CT定量参数模型和基于两者联合的模型之间曲线下面积的差异有统计学意义(Z=-3.870, P= 0.001)。 结论 相较于常规CT征象或双能量CT多定量参数,两者联合对鉴别卵巢原发上皮性肿瘤良恶性的诊断效能更高。 Abstract:Objective To explore the clinical application value of multiple quantitative dual-energy CT parameters combined with conventional CT signs to identify benign and malignant primary epithelial tumors of the ovary. Methods A retrospective study was conducted in 166 cases with primary epithelial tumors of the ovary confirmed by pathology findings from January 2021 to June 2023 continuously at the First People's Hospital of Yancheng City. All patients underwent contrast-enhanced dualenergy CT scans within 2 weeks prior to surgery. Patients were devided into benign group (n=74) and malignant group (n=92) according to pathology. Common clinical characteristics and conventional CT signs were recorded. Two independent observers measured the lesion-related quantitative dual-energy CT parameters: iodine concentrations of arterial and venous phases, standardized iodine concentrations, and monoenergetic CT values at 40, 50, 60, 70, 80, 90 keV levels. The slope of energy spectrum curve (K40-90 keV) during both arterial and venous phase were calculated. Intra-group correlation coefficient was used to evaluate the consistency of the parameters obtained by the 2 observers. Differences in parameters between the two groups were compared. Variables with a P-value less than 0.1 were selected as input variables for constructing stepwise binary logistic regression models based on conventional CT signs, quantitative dual-energy CT parameters and the combination of both. The efficacy of the three models in the differential diagnosis of benign and malignant ovarian tumors were evaluated with ROC curve. The areas under these curves were compared using the DeLong test. Results Parameters of the arterial and venous phase obtained by the two observers showed consistency in the two groups. The intra-group correlation coefficients were all above 0.75. Significant differences were found in general clinical characteristics (age, clinical symptoms), eight conventional CT signs (tumor location, morphology, boundary, density, ascites, metastases to peritoneum/omentum, supradiaphragmatic lymph nodes, and other organs or not), and various quantitative dual-energy CT parameters (CT40keV, CT50keV, CT60keV, CT70keV, CT80keV, CT90keV, K40-90keV, iodine concentration and standardized iodine concentration) in benign and malignant groups (P < 0.05). The area under ROC curve of binary logistic regression model based on conventional CT signs, quantitative dualenergy CT parameters and their combination were 0.760, 0.764, 0.883 respectively. According to the DeLong test, no significant difference was found in the area under the curve between the model based on conventional CT signs and the quantitative dual-energy CT parameters model (Z=-0.659, P=0.510). Significant differences were observed between the models based on conventional CT signs and the combined model (Z=-4.007, P < 0.001), and between the quantitative dual-energy CT parameters model and the combined model (Z=-3.870, P=0.001). Conclusion Compared with conventional CT signs or multiple quantitative dual-energy CT parameters, the combination of them has better diagnostic performance in differentiating benign from malignant primary epithelial tumors of the ovary. -

图 1 基于常规CT征象、双能量CT定量参数及两者联合模型诊断卵巢癌的ROC曲线
Figure 1. ROC curves for the diagnosis of ovarian cancer based on conventional CT signs, quantitative dual-energy CT parameters, and a combined model of both.

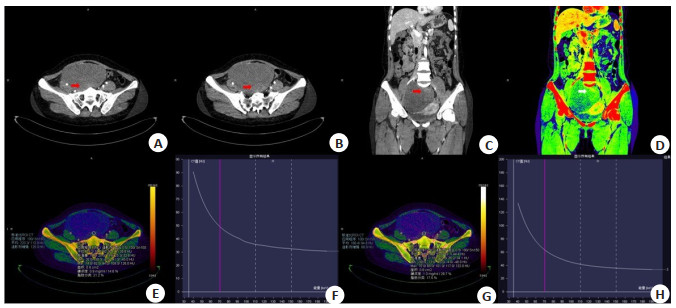
图 2 良性组患者常规CT征象及双能量CT定量参数测量结果
Figure 2. Conventional CT signs and quantitative dual-energy CT parameter measurements in the benign group of patients. Female patient, 39 years old, with lower abdominal pain and discomfort for more than a month, postoperative pathology was mucinous cystadenoma of the right ovary. CT showed a rounded mass in the right pelvis, with smooth borders, predominantly cystic components and a few solid components (arrows), no signs of metastasis in the abdominal organs, no obvious enlarged lymph nodes in the abdominal cavity or retroperitoneum, and no fluid accumulation in the abdominal cavity. A-D: 40 keV transverse and coronal images and iodine density map in arterial phase; E-F: Transverse iodine density map in arterial phase and energy spectral curve; G-H: Transverse iodine density map in venous phase and energy spectrum curve.

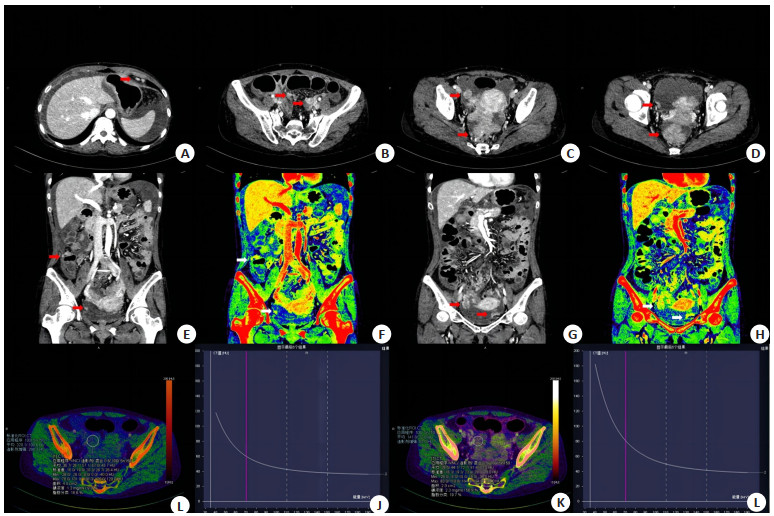
图 3 恶性组患者常规CT征象及双能量CT定量参数测量结果
Figure 3. Conventional CT signs and quantitative dual-energy CT parameter measurements in the malignant group of patients. Female patient, 49 years old, abdominal pain and bloating for one week, postoperative pathology was high grade plasma carcinoma of bilateral ovaries. CT showed an irregular soft tissue mass in the pelvis with irregular borders, enlarged lymph nodes in the heart-diaphragm angle and pelvis, multiple metastatic nodules in the greater omentum and peritoneum, marked enhancement, and hyperiodinemia on iodine mapping (shown by arrows), accompanied by peritoneal fluid accumulation. A-D: Arterial phase 40 keV transverse images; E-H: Coronal image and iodine density map; I-J: Transverse iodine density map in arterial phase and energy spectral curve; K-L: Transverse iodine density map in venous phase and energy spectrum curve.
表 1 两组患者一般临床特点及常规CT特征对比
Table 1. Comparison of general information and conventional CT signs between the two groups of patients
Index Benign group (n=74) Malignant group(n=92) χ2/t P Age(year, Mean±SD) 51. 81±16. 75 57.61±11.13 2.56 0.012 Clinical symptoms [n(%)] 6.77 0.009 No 54(52.4) 49(47.6) Yes 20(31.7) 43(68.3) Occurrence site [n(%)] - < 0.001 Left 28(52.8) 25(47.2) Right 44(65.7) 23(34.3) Duplex 2(4.3) 44(95.7) Morphology [n(%)] 21.49 < 0.001 Orbicular 42(67.7) 20(32.3) Irregular 32(30.8) 72(69.2) Margin [n(%)] 19.99 < 0.001 Clearly 59(58.4) 42(41.6) Unclearly 15(23.1) 50(76.9) Density [n(%)] 16.16 < 0.001 Cystic mainly 58(56.9) 44(43.1) Solid mainly 16(25) 48(75) Hydrothorax [n(%)] 2.92 0.088 No 66(47.5) 73(52.5) Yes 8(29.6) 19(70.4) Hydroperitoneum [n(%)] 17.13 < 0.001 No 48(61.5) 30(38.5) Yes 26(29.5) 62(70.5) Retroperitoneal lymph nodes [n(%)] 2.92 0.088 No 66(47.5) 73(52.5) Yes 8(29.6) 19(70.4) Inguinal lymph nodes [n(%)] 0.15 0.703 No 62(45.3) 75(54.7) Yes 12(41.4) 17(58.6) Supradiaphragmatic lymph nodes [n(%)] 12.26 < 0.001 No 62(53.4) 54(46.6) Yes 12(24) 38(76) Other organ metastases [n(%)] - < 0.001 No 74(52.1) 68(47.9) Yes 0(0) 24(100) Peritoneal/omental metastasis [n(%)] - < 0.001 No 74(59.7) 50(40.3) Yes 0(0) 42(100) Maximum diameter of tumor (mm, Mean±SD) 79.55±37.28 81.09±45.45 0.23 0.818 -: Fisher exact probability method, no value.  下载: 导出CSV
表 2 动脉期2位测量者对良性组及恶性组各参数及一致性检测结果
Table 2. Results of each parameter and concordance test for patients in the benign group and malignant group by two observers during the arterial phase (Mean±SD)
Index Benign group (n=74) Malignant group (n=92) Observer 1 Observer 2 ICC Observer 1 Observer 2 ICC CT40keV(Hu) 55.78±31.40 62.91±32.55 0.805 96.15±54.13 107.53±57.34 0.814 CT50keV(Hu) 42.70±22.19 56.83±24.34 0.812 74.04±35.75 82.17±37.90 0.824 CT60keV(Hu) 38.40±17.98 45.54±19.12 0.811 60.21±25.52 69.52±27.23 0.806 CT70keV(Hu) 36.70±15.12 39.84±17.24 0.802 51.49±19.50 60.15±22.25 0.811 CT80keV(Hu) 34.97±14.29 36.81±15.40 0.842 48.27±16.29 54.93±18.06 0.808 CT90keV(Hu) 32.71±14.03 35.75±14.54 0.883 44.01±14.41 49.59±15.05 0.814 IC(mg/mL) 0.43±0.45 0.47±0.48 0.753 0.54±0.37 0.81±0.51 0.754 NIC(%) 4.67±4.66 5.19±5.99 0.797 7.65±4.97 7.46±5.01 0.796 IC: Iodine concentration; NIC: Normalized iodine concentration; ICC: Interclass correlation coefficient.
下载: 导出CSV
表 3 静脉期2位测量者对良性组及恶性组各参数及一致性检测结果
Table 3. Results of each parameter and concordance test for patients in the benign group and malignant group by two observers during the intravenous period (Mean±SD)
Index Benign group (n=74) Malignant group (n=92) Observer 1 Observer 2 ICC Observer 1 Observer 2 ICC CT40keV(Hu) 83.25±56.39 89.39±59.21 0.798 138.19±68.62 149.27±71.61 0.893 CT50keV (Hu) 62.72±39.95 68.99±42.01 0.796 101.13±45.70 112.93±37.40 0.789 CT60keV (Hu) 51.09±29.22 55.36±31.29 0.794 80.24±32.46 89.09±34.24 0.775 CT70keV(Hu) 42.39±23.61 49.65±24.67 0.792 66.81±24.43 74.48±26.14 0.759 CT80keV (Hu) 39.34±20.08 43.61±22.14 0.790 58.36±18.34 65.48±21.11 0.758 CT90keV (Hu) 29.27±15.18 34.54±15.24 0.789 51.69±16.07 59.68±18.88 0.767 IC (mg/mL) 0.67±0.24 0.76±0.32 0.844 1.16±0.40 1.44±0.55 0.806 NIC (%) 14.36±3.84 18.35±4.79 0.796 22.38±8.09 26.92±8.95 0.770
下载: 导出CSV
表 4 动脉期两组患者双能量CT各参数
Table 4. Each parameter of dual-energy CT in two groups of patients in arterial phase (Mean±SD)
Index Benign group (n=74) Malignant group (n=92) t P CT40keV(Hu) 59.95±32.25 101.43±55.14 5.728 < 0.001 CT50keV(Hu) 49.10±23.67 78.95±36.85 6.035 < 0.001 CT60keV(Hu) 42.51±18.98 65.18±26.25 6.232 < 0.001 CT70keV(Hu) 38.39±16.51 56.85±20.27 6.324 < 0.001 CT80keV(Hu) 35.73±15.16 51.41±16.94 6.209 < 0.001 CT90keV(Hu) 33.85±14.37 47.64±14.87 6.028 < 0.001 K40-90keV 0.52±0.47 1.08±0.91 4.746 < 0.001 IC(mg/mL) 0.45±0.25 0.67±0.43 3.273 0.01 NIC (%) 4.93±2.23 7.53±4.72 3.342 0.01
下载: 导出CSV
表 5 静脉期两组患者双能量CT各参数
Table 5. Each parameter of dual-energy CT in two groups of patients in venous phase (Mean±SD)
Index Benign group (n=74) Malignant group (n=92) t P CT40keV(Hu) 86.01±58.11 145.91±70.81 5.86 < 0.001 CT50keV(Hu) 65.89±40.75 107.71±46.79 6.06 < 0.001 CT60keV(Hu) 53.65±30.57 84.86±33.17 6.34 < 0.001 CT70keV(Hu) 46.06±24.62 70.69±25.16 6.33 < 0.001 CT80keV(Hu) 41.17±21.04 61.55±20.39 6.31 < 0.001 CT90keV(Hu) 37.83±18.87 55.38±17.43 6.22 < 0.001 K40-90keV 0.96±0.86 1.81±1.15 5.24 < 0.001 IC(mg/mL) 0.72±0.28 1.30±0.48 9.14 < 0.001 NIC (%) 16.81±4.05 25.37±8.58 7.91 < 0.001
下载: 导出CSV
表 6 卵巢癌独立危险因素的二元Logistic回归分析
Table 6. Binary Logistic regression analysis of independent risk factors for ovarian cancer
Independent risk factors B SE OR(95% CI) P Margin 1.384 0.347 3.992(2.023-7.875) 0.001 Density 1.367 0.679 3.924(1.037-14.850) 0.044 Venous phase NIC -0.557 0.240 0.573(0.358-0.917) 0.020
下载: 导出CSV
-
[1] McCluggage WG, Singh N, Gilks CB. Key changes to the World Health Organization (WHO) classification of female genital tumours introduced in the 5th edition (2020)[J]. Histopathology, 2022, 80(5): 762-78. doi: 10.1111/his.14609 [2] Taylor EC, Irshaid L, Mathur M. Multimodality imaging approach to ovarian neoplasms with pathologic correlation[J]. RadioGraphics, 2021, 41(1): 289-315. doi: 10.1148/rg.2021200086 [3] Ribatti D. The discovery of the fundamental role of VEGF in the development of the vascular system[J]. Mech Dev, 2019, 160: 103579. doi: 10.1016/j.mod.2019.103579 [4] 韩宇航. IMP3、CD44v6、VEGF-C在卵巢上皮性肿瘤中的表达及意义[D]. 西宁: 青海大学, 2021. [5] 刘碧英, 林晓南, 张小镇, 等. DCE-MRI及多b值DWI对卵巢上皮源性肿瘤良恶性的鉴别诊断价值[J]. 放射学实践, 2021, 36(2): 216-21. https://www.cnki.com.cn/Article/CJFDTOTAL-FSXS202102017.htm [6] 付婷婷, 高欣, 刘家艳, 等. 基于CT联合血清CA125、HE4对卵巢上皮性肿瘤良、恶性的鉴别诊断价值研究[J]. 中国血液流变学杂志, 2022, 32(2): 309-13. [7] 安冬会, 吴绍全, 邓小林, 等. 能谱CT联合常规CT检查、血清CA125检测在鉴别诊断卵巢囊性病变性质中的应用价值[J]. 当代医药论丛, 2022, 20(10): 140-3. [8] Nougaret S, Lakhman Y, Gönen M, et al. High- grade serous ovarian cancer: associations between BRCA mutation status, CT imaging phenotypes, and clinical outcomes[J]. Radiology, 2017, 285(2): 472-81. doi: 10.1148/radiol.2017161697 [9] 郭利清, 杨舟. 超声造影、CT、MRI在卵巢肿瘤临床应用比较[J]. 中国CT和MRI杂志, 2016, 14(10): 92-5. doi: 10.3969/j.issn.1672-5131.2016.10.030 [10] Patino M, Prochowski A, Agrawal MD, et al. Material separation using dual-energy CT: current and emerging applications[J]. Radiographics, 2016, 36(4): 1087-105. doi: 10.1148/rg.2016150220 [11] Adam SZ, Rabinowich A, Kessner R, et al. Spectral CT of the abdomen: where are we now[J]? Insights Imag, 2021, 12(1): 1-16. doi: 10.1186/s13244-020-00954-8 [12] 隋愿, 张丽英, 王兴龙, 等. 双能量CT增强碘图形态学特征联合标准化碘浓度对良恶性甲状腺结节的鉴别诊断价值[J]. 癌症进展, 2022, 20(21): 2206-9. https://www.cnki.com.cn/Article/CJFDTOTAL-AZJZ202221003.htm [13] 石海, 赵琳, 李兴杰. 西门子双源CT双能量扫描对肺癌鉴别诊断及预后评估的价值观察[J]. 中国CT和MRI杂志, 2022, 20(9): 63-4. https://www.cnki.com.cn/Article/CJFDTOTAL-CTMR202209059.htm [14] 路凯, 兰国宾, 戴士林. 双源CT双能量虚拟平扫对结直肠良恶性肿瘤的鉴别诊断价值研究[J]. 中国CT和MRI杂志, 2021, 19(9): 131-4. https://www.cnki.com.cn/Article/CJFDTOTAL-CTMR202109031.htm [15] 杨红耀, 郭哲, 张欣贺. FAP-α和VEGF在卵巢癌组织中的表达及意义[J]. 实用癌症杂志, 2023, 38(3): 394-7. https://www.cnki.com.cn/Article/CJFDTOTAL-SYAZ202303011.htm [16] Li GJ, Gao J, Wang GL, et al. Correlation between vascular endothelial growth factor and quantitative dual-energy spectral CT in non-small-cell lung cancer[J]. Clin Radiol, 2016, 71(4): 363-8. doi: 10.1016/j.crad.2015.12.013 [17] Han X, Li B, Sun M, et al. Application of contrast-enhanced dualenergy spectral CT for differentiating borderline from malignant epithelial ovarian tumours[J]. Clin Radiol, 2021, 76(8): 585-92. doi: 10.1016/j.crad.2021.04.004 [18] 王鑫毅, 徐锦媚, 白雪莲, 等. CT能谱成像对胃癌诊断价值的初步探讨[J]. 现代肿瘤医学, 2020, 28(13): 2295-9. https://www.cnki.com.cn/Article/CJFDTOTAL-SXZL202013025.htm [19] 辛涛, 张欣贤, 于啸, 等. 能谱CT在肾母细胞瘤病理分型中的应用价值[J]. 实用放射学杂志, 2023, 39(1): 121-4. [20] 宁思阳, 尚乃舰, 姜智允, 等. 双源CT双能量扫描在肺病灶良恶性诊断中的应用研究[J]. 现代肿瘤医学, 2021, 29(9): 1593-6. https://www.cnki.com.cn/Article/CJFDTOTAL-SXZL202109030.htm [21] Wei JY, Zhao JH, Zhang XL, et al. Analysis of dual energy spectral CT and pathological grading of clear cell renal cell carcinoma (ccRCC)[J]. PLoS One, 2018, 13(5): e0195699. doi: 10.1371/journal.pone.0195699 [22] 许晓泉, 周燕, 苏国义, 等. 联合CT图像特征和双能CT定量参数对甲状腺乳头状癌颈部淋巴结转移的诊断价值[J]. 中华放射学杂志, 2021, 55(2): 137-42. [23] 马春雨, 吕娜, 邹梦梦, 等. 能谱CT及碘基图影像组学诺模图在预测上皮性卵巢癌分型中的应用价值[J]. 分子影像学杂志, 2023, 46(4): 632-7. doi: 10.12122/j.issn.1674-4500.2023.04.10 [24] 廖蔚, 黄强, 张雅琳, 等. 增强CT图像的深度学习分类技术在卵巢肿瘤良恶性预测中的应用[J]. 实用医院临床杂志, 2023, 20(1): 52-6. https://www.cnki.com.cn/Article/CJFDTOTAL-YYLC202301014.htm [25] 姜明瀚, 黄松, 盛伟华, 等. 双能CT鉴别诊断卵巢良性和恶性肿瘤的价值[J]. 海南医学, 2020, 31(24): 3214-8. https://www.cnki.com.cn/Article/CJFDTOTAL-HAIN202024025.htm [26] Elsherif SB, Zheng S, Ganeshan D, et al. Does dual-energy CT differentiate benign and malignant ovarian tumours?[J]. Clin Radiol, 2020, 75(8): 606-14. doi: 10.1016/j.crad.2020.03.006 -

 点击查看大图
计量
- 文章访问数: 53
- HTML全文浏览量: 13
- PDF下载量: 8
- 被引次数: 0