


Relationship between CT imaging features of non-small cell lung cancer and expression of Ki-67 and vascular endothelial growth factor
-
摘要:
目的 分析非小细胞肺癌(NSCLC)CT影像特征与Ki-67、血管内皮生长因子(VEGF)的表达关系,为NSCLC的临床诊治及判断预后提供理论依据。 方法 回顾性收集我院2018年1月~2023年1月112例确诊为NSCLC的患者,采用Philips Brilliance 256iCT检查患者CT影像特征,检测NSCLC组织中Ki-67、VEGF的表达,分析影像特征、临床资料(病理类型、性别、年龄、吸烟史)与Ki-67、VEGF表达水平的关系。 结果 CT特征与Ki-67表达关系中,出现毛刺征、深分叶征、动脉期强化CT值≥ 20 Hu、静脉期强化CT值≥20 Hu、肺门淋巴结肿大、直径≥3 cm,Ki-67阳性表达率高(P < 0.05);出现钙化、胸膜牵拉征,Ki-67阳性表达率低(P < 0.05);其余指标差异无统计学意义(P>0.05)。CT特征与VERF表达关系中, 出现血管集束征、动脉期明显强化≥20 Hu、直径≥3 cm、肺门淋巴结肿大,VEGF阳性表达率高(P < 0.05);出现空泡征、深分叶征、直径 < 3 cm,VEGF阳性表达率低(P<0.05)。临床资料与Ki-67、VEGF表达关系中,男性、有吸烟史、患者中Ki-67阳性表达率高,病理类型为鳞癌Ki-67阳性表达率低,差异有统计学意义(P < 0.05);VEGF表达与临床资料组间差异均无统计学意义(P>0.05)。 结论 NSCLC患者的CT影像特征与Ki-67、VEGF中的表达状态密切相关,一定程度上可推测免疫组化指标表达情况。 Abstract:Objective To explore the relationship between CT imaging features of non-small cell lung cancer (NSCLC) and the expression of Ki- 67 and vascular endothelial growth factor (VEGF), providing a theoretical basis for the clinical diagnosis, treatment, and prognosis of NSCLC. Methods A retrospective analysis of 112 patients diagnosed with NSCLC in our hospital from January 2018 to January 2023. Philips Brilliance 256iCT was used to examine CT imaging features, and the expression of Ki-67 and VEGF in NSCLC tissues was detected. The relationship between imaging features, clinical data (pathological type, gender, age, smoking history), Ki- 67 and VEGF expression levels was analyzed. Results In the relationship between CT features and Ki-67 expression, the presence of spiculation sign, deep lobulation sign, arterial phase enhancement CT value ≥20 Hu, venous phase enhancement CT value ≥20 Hu, enlargement of mediastinal lymph nodes and diameter ≥3 cm was associated with a high Ki- 67 positive expression rate (P < 0.05). The presence of calcification and pleural traction sign was associated with a low Ki- 67 positive expression rate (P < 0.05). Other indicators showed no statistical significance. In the relationship between CT features and VEGF expression, the presence of vessel convergence sign, significant enhancement in the arterial phase ≥20 Hu, diameter ≥3 cm, and enlargement of mediastinal lymph nodes was associated with a high VEGF positive expression rate (P < 0.05). The presence of air bronchogram sign, deep lobulation sign, and diameter < 3 cm was associated with a low VEGF positive expression rate (P < 0.05). In the relationship between clinical data and Ki-67 and VEGF expression, males, those with a smoking history, and a high Ki-67 positive expression rate in patients, and a low Ki-67 positive expression rate in squamous cell carcinoma, were statistically significant (P < 0.05). There was no statistical difference in VEGF expression between different clinical data groups (P>0.05). Conclusion CT imaging features in NSCLC patients are closely related to the expression of Ki-67 and VEGF, providing a certain predictive value for immunohistochemical marker expression. -
Key words:
- CT features /
- non-small cell lung cancer /
- Ki-67 /
- vascular endothelial growth factor
-

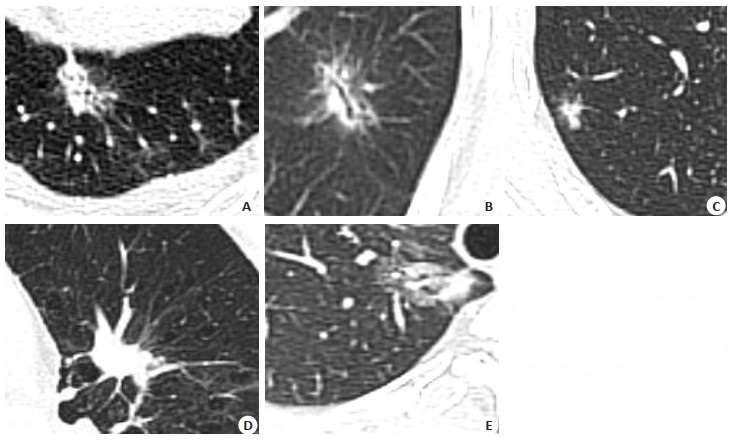
图 1 典型病例
Figure 1. Typical cases. A: Pleural traction and burr; B: Air bronchus; C: Deep lobulated; D: Vascular cluster; E: Sign of cavitation.

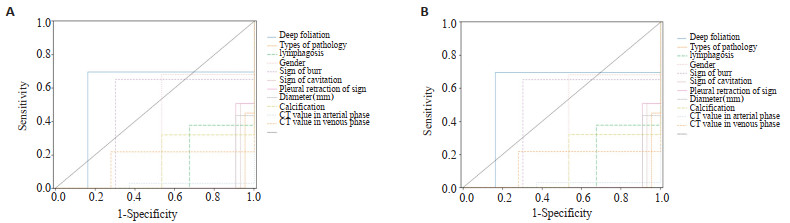
图 2 CT征像诊断Ki-67(A)和VEGF(B)的ROC曲线分析
Figure 2. ROC curve analysis of CT signs in the diagnosis of Ki-67 (A) abd VEGF (B).
表 1 Ki-67、VEGF与CT特征间的统计学分析
Table 1. Statistical analysis of Ki-67, VEGF and CT features [n(%)]
Index Ki-67 VEGF Positive Negative χ2 P Positive Negative χ2 P Gender 30.097 <0.001 0.676 0.411 Female 21(36.84) 36(63.16) 24(42.11) 33(57.89) Male 48(87.27) 7(12.73) 19(34.55) 36(65.45) Age (year) 0.141 0.707 0.707 0.428 ≥60 36(60.00) 24(40.00) 21(35.00) 39(65.00) <60 33(63.46) 19(36.54) 22(42.31) 30(57.69) Smoking history 20.133 0.001 1.966 0.161 No 28(43.75) 36(56.25) 21(32.81) 43(67.19) Yes 41(85.42) 7(14.58) 22(45.83) 22(45.83) Vessel convergence sign 0.193 0.356 10.262 0.002 No 33(53.22) 29(46.77) 12(24.19) 40(64.51) Yes 36(72.00) 14(28.00) 31(62.00) 19(38.00) Spicule sign 12.986 <0.001 1.391 0.149 No 30(55.56) 24(44.44) 14(25.93) 40(74.07) Yes 13(22.41) 45(77.59) 29(50.00) 29(50.00) Deep lobulation sign 9.618 0.001 9.727 0.002 No 22(52.38) 20(47.62) 14(33.33) 28(66.67) Yes 47(67.14) 23(32.86) 29(41.43) 41(58.57) Bubble sign 3.139 0.094 32.471 <0.001 No 14(37.83) 23(62.16) 28(75.68) 9(24.32) Yes 55(73.33) 20(26.66) 15(20.00) 60(80.00) Air bronchogram 1.396 1.396 3.525 0.06 No 33(88.00) 17(12.00) 24(48.00) 26(52.00) Yes 36(40.32) 26(59.68) 19(30.65) 43(69.35) Pleural traction sign 18.882 <0.001 0.028 0.866 No 37(89.47) 1(0.026) 15(39.47) 23(60.53) Yes 32(43.24) 42(56.75) 28(37.84) 46(62.16) Calcification 24.972 <0.001 1.812 0.328 No 39(90.70) 4(9.30) 22(51.16) 21(48.84) Yes 30(43.48) 39(56.52) 21(30.43) 48(69.57) Diameter 5.144 0.023 23.671 0.001 ≥3 cm 47(70.15) 20(29.85) 38(56.72) 29(43.28) <3 cm 22(48.89) 23(51.11) 5(11.11) 40(88.89) Boundary 2.123 0.142 2.21 0.137 Blur 36(72.00) 14(28.00) 23(46.00) 27(54.00) Clarity 33(53.23) 29(46.77) 20(32.26) 42(67.74) CT value in arterial phase 23.12 <0.001 1.022 0.004 ≥20 Hu 67(71.28) 27(28.72) 56(59.57) 38(40.43) <20 Hu 2(11.11) 16(88.89) 2(27.78) 13(72.22) CT value in venous phase 9.551 <0.001 0.028 0.868 ≥20 Hu 54(63.53) 31(36.47) 33(38.82) 52(61.18) <20 Hu 15(55.56) 12(44.44) 10(37.04) 17(62.96) Lymphadenectasis 9.388 0.002 11.626 <0.001 No 43(75.44) 14(24.56) 52(91.22) 5(0.087) Yes 26(47.27) 29(52.73) 34(61.81) 21(38.18)  下载: 导出CSV
表 2 Ki-67、VEGF与病理类型间的关系
Table 2. Relationship between Ki-67, VEGF and pathological types [n(%)]
Pathological type (%) Ki-67 VEGF Positive Negative Positive Negative Adenocarcinoma 18(45.00) 22(55.00) 20(50.00) 20(50.00) Squamous carcinoma 21(29.17) 51(70.83) 23(31.94) 49(68.06) χ2 29.334 0.865 P <0.001 0.194
下载: 导出CSV
表 3 组间差异有统计学意义征像与Ki-67表达的二元Logistic回归分析
Table 3. Binary Logistic regression analysis of signs with statistically significant differences between groups and Ki- 67 expression
Item Regression coefficient Standard error Z Wald χ2 P OR Gender -4.550 1.410 -3.227 10.415 0.001 0.011 Deep lobulation sign 0.315 0.315 5.166 3.216 <0.001 1.165 Lymphadenectasis -1.164 0.916 -1.272 1.618 0.203 0.312 Pathological pattern 0.293 0.656 3.941 3.136 0.001 3.568 Spicule sign 1.514 0.315 1.549 2.399 0.121 4.119 Sign of cavitation -4.932 1.188 -4.153 17.250 0.001 0.007 Pleural traction sign -1.636 1.035 -1.557 2.423 0.120 0.200 Calcification -1.516 0.836 -1.881 3.537 0.060 0.217 Diameter(cm) -3.493 0.964 -3.683 13.563 <0.001 0.029 CT value in arterial phase -2.201 1.048 -2.100 4.410 0.036 0.111 CT value in venous phase -0.124 0.747 -0.165 0.027 0.869 0.884 Intercept 13.658 3.219 3.155 13.315 <0.001 3213.914
下载: 导出CSV
表 4 CT征像与Ki-67的AUC曲线分析
Table 4. AUC curve analysis of CT signs and Ki-67
Item AUC Standard error P 95% CI Gender 0.573 0.056 0.194 0.463-0.683 Deep lobulation sign 0.766 0.047 <0.001 0.675-0.858 Types of pathology 0.248 0.046 <0.001 0.159-0.337 Lymphadenectasis 0.351 0.054 0.008 0.246-0.456 Sign of burr 0.675 0.053 0.008 0.246-0.456 Sign of cavitation 0.289 0.048 <0.001 0.194-0.383 Pleural traction sign 0.300 0.049 <0.001 0.204-0.397 Calcification 0.264 0.047 <0.001 0.171-0.356 Diameter(cm) 0.392 0.055 0.055 0.283-0.501 CT value in arterial phase 0.328 0.056 0.002 0.219-0.438 CT value in venous phase 0.469 0.057 0.584 0.358-0.580
下载: 导出CSV
表 5 组间差异有统计学意义的征像与VEGF表达的二元Logistic回归分析
Table 5. Binary Logistic regression analysis of signs with statistically significant differences between groups and VEGF expression
Item Regression coefficient Standard error Z Wald χ2 P OR Vessel convergence sign -1.023 0.555 -1.844 3.399 0.065 0.360 Deep lobulation sign -0.171 0.572 -0.298 0.089 0.766 0.843 Sign of cavitation -2.615 0.615 -4.255 18.103 <0.001 0.073 Diameter cm -2.712 0.677 -4.008 16.065 <0.001 0.066 Intercept 9.107 2.080 4.378 19.171 <0.001 9015.803
下载: 导出CSV
表 6 CT征像与VEGF的AUC曲线分析
Table 6. AUC curve analysis of CT signs and VEGF
Headline AUC Standard error P 95% CI Vessel convergence sign 0.345 0.053 0.006 0.242-0.449 Deep lobulation sign 0.540 0.056 0.477 0.431-0.650 Sign of cavitation 0.240 0.050 <0.001 0.142 -0.337 Diameter cm 0.268 0.048 <0.001 0.175 -0.362
下载: 导出CSV
-
[1] Sung H, Ferlay J, Siegel RL, et al. Global cancer statistics 2020: GLOBOCAN estimates of incidence and mortality worldwide for 36 cancers in 185 countries[J]. CA Cancer J Clin, 2021, 71(3): 209-49. doi: 10.3322/caac.21660 [2] Guo HX, Xue WF, Zhao QT, et al. Correlation and significance of COX-2, Ki67, VEGF and other immune indexes with the growth of malignant pulmonary nodules[J]. J Cardiothorac Surg, 2022, 17(1): 290. doi: 10.1186/s13019-022-02039-7 [3] 杨新蕊, 闫呈新, 朱建忠. 周围型肺癌CT征象与Ki-67、TTF-1、p63表达的相关性分析[J]. 现代肿瘤医学, 2021, 29(18): 3204-9. https://www.cnki.com.cn/Article/CJFDTOTAL-SXZL202118015.htm [4] Chen C, Zhu WD, Zhang XH, et al. Value of Ki-67 and computed tomography in the assessment of peripheral lung adenocarcinoma [J]. Br J Biomed Sci, 2016, 73(1): 32-7. doi: 10.1080/09674845.2016.1146434 [5] 杨文洁, 严福华. 2015版《低剂量螺旋CT肺癌筛查专家共识》和《肺亚实性结节影像处理专家共识》解读[J]. 诊断学理论与实践, 2017, 16(1): 32-7. https://www.cnki.com.cn/Article/CJFDTOTAL-ZDLS201701010.htm [6] 向靖, 陆友金. Ki-67与肺癌关系的研究进展[J]. 临床肺科杂志, 2012, 17(4): 706-7. https://www.cnki.com.cn/Article/CJFDTOTAL-LCFK201204064.htm [7] Zhu WY, Hu XF, Fang K, et al. Prognostic value of mutant p53, Ki-67, and TTF-1 and their correlation with EGFR mutation in patients with non-small cell lung cancer[J]. Histol Histopathol, 2019, 34: 1269-78. [8] He LY, Zhang H, Wang Z, et al. Diagnostic and prognostic significance of E-cadherin and Ki-67 expression in non-small cell lung cancer patients[J]. Eur Rev Med Pharmacol Sci, 2016, 20: 3812-7. [9] Bao JY, Liu YQ, Ping XX, et al. Preoperative Ki-67 proliferation index prediction with a radiomics nomogram in stage T1a-b lung adenocarcinoma[J]. Eur J Radiol, 2022, 155: 110437. doi: 10.1016/j.ejrad.2022.110437 [10] VanderLaan PA. Non-small cell lung cancer predictive biomarker testing via immunocytochemistry: ways of future past?[J]. Cancer Cytopathol, 2019, 127(5): 278-80. doi: 10.1002/cncy.22138 [11] 李轶伦. 早期周围型肺癌CT征象分析[J]. 继续医学教育, 2019, 33(2): 144-5. https://www.cnki.com.cn/Article/CJFDTOTAL-JYJY201902075.htm [12] 王姣, 卢海燕. 肺癌HRCT征象与TTF-1和Ki-67指标的对照研究[J]. 西藏医药, 2019, 40(4): 27-8. https://www.cnki.com.cn/Article/CJFDTOTAL-XZYY201904011.htm [13] Yue JY, Chen J, Zhou FM, et al. CT-pathologic correlation in lung adenocarcinoma and squamous cell carcinoma[J]. Medicine (Baltimore), 2018, 97: e13362. doi: 10.1097/MD.0000000000013362 [14] 张艳, 吕发金, 褚志刚, 等. 基于CT薄层影像特征的肺结节良恶性评估[J]. 中国医学影像学杂志, 2019, 27(3): 182-7. doi: 10.3969/j.issn.1005-5185.2019.03.005 [15] Yao W, Liao YF, Li XP, et al. Noninvasive method for predicting the expression of Ki67 and prognosis in non-small-cell lung cancer patients: radiomics[J]. J Healthc Eng, 2022, 2022:1-9. [16] 顾潜彪, 冯智超, 梁琪, 等. 建立CT影像组学标签预测非小细胞肺癌Ki-67表达水平[J]. 中南大学学报(医学版), 2018, 43(11): 1216-22. https://www.cnki.com.cn/Article/CJFDTOTAL-HNYD201811009.htm [17] 吴志涛, 上官伦, 徐冰洁. 周围型肺癌CT征象与Ki-67、p53表达的关系[J]. 分子影像学杂志, 2023, 46(1): 124-8. doi: 10.12122/j.issn.1674-4500.2023.01.24 [18] Qiu ZX, Cheng Y, Liu D, et al. Clinical, pathological, and radiological characteristics of solitary ground-glass opacity lung nodules on high-resolution computed tomography[J]. Ther Clin Risk Manag, 2016, 12: 1445-53. doi: 10.2147/TCRM.S110363 [19] Ren HN, Ma JB, Wang JA. Correlation between apparent diffusion coefficient and Ki-67 in different pathological types of lung cancer [J]. Transl Cancer Res TCR, 2021, 10(12): 5364-71. doi: 10.21037/tcr-21-2515 [20] Gao F, Sun YL, Zhang GZ, et al. CT characterization of different pathological types of subcentimeter pulmonary ground-glass nodular lesions[J]. Br J Radiol, 2019, 92(1094): 20180204. doi: 10.1259/bjr.20180204 [21] 李明玉, 韩栋, 娄杨, 等. 周围型肺癌CT征象、病理及Ki-67指数表达相关性研究[J]. 影像研究与医学应用, 2018, 2(5): 71-2. https://www.cnki.com.cn/Article/CJFDTOTAL-YXYY201805043.htm [22] 李科, 曹永清, 肖劲军, 等. TTF-1、NapsinA和Ki-67在非小细胞肺癌中的表达及意义[J]. 河北医药, 2018, 40(5): 735-8. https://www.cnki.com.cn/Article/CJFDTOTAL-HBYZ201805023.htm [23] Xu J, Liu PP, Da J, et al. Prognostic value of Ki-67 in stage Ⅰ nonsmall-cell lung cancer: a meta-analysis involving 1931 patients[J]. Pathol Res Pract, 2019, 215(5): 855-60. doi: 10.1016/j.prp.2019.02.020 [24] Ding MH, Liu L, Hu CX, et al. Expression of VEGFR2 and NRP-1 in non-small cell lung cancer and their clinical significance[J]. Chin J Cancer Res, 2014, 26(6): 669-77. [25] Aguilar-Cazares D, Chavez-Dominguez R, Carlos-Reyes A, et al. Contribution of angiogenesis to inflammation and cancer[J]. Front Oncol, 2019, 9: 1399. doi: 10.3389/fonc.2019.01399 [26] Cohen B, Tempelhof H, Raz T, et al. BACH family members regulate angiogenesis and lymphangiogenesis by modulating VEGFC expression[J]. Life Sci Alliance, 2020, 3(4): e202000666. doi: 10.26508/lsa.202000666 [27] 王冬梅. 周围型肺癌癌组织中VEGF、PCNA表达变化及与螺旋CT征象的关系[J]. 山东医药, 2013, 53(23): 55-7. https://www.cnki.com.cn/Article/CJFDTOTAL-SDYY201323026.htm [28] Li Z, Xu W, Gu T, et al. Tumor size, but not consolidation-to-tumor ratio, is an independent prognostic factor for part-solid clinical T1 non-small cell lung cancer[J]. Thorac Cancer, 2023, 14(6): 602-11. doi: 10.1111/1759-7714.14788 [29] Sadremomtaz A, Mansouri K, Alemzadeh G, et al. Dual blockade of VEGFR1 and VEGFR2 by a novel peptide abrogates VEGF-driven angiogenesis, tumor growth, and metastasis through PI3K/AKT and MAPK/ERK1/2 pathway[J]. Biochim Biophys Acta BBA Gen Subj, 2018, 1862(12): 2688-700. doi: 10.1016/j.bbagen.2018.08.013 [30] 丁家宝, 高鲲, 张倩. LKB1、VEGFR2在非小细胞肺癌组织中表达及临床意义[J]. 中国实验诊断学, 2023, 27(7): 799-801. doi: 10.3969/j.issn.1007-4287.2023.07.011 [31] Fu S, Hou MM, Naing A, et al. Phase Ⅰ study of pazopanib and vorinostat: a therapeutic approach for inhibiting mutant p53-mediated angiogenesis and facilitating mutant p53 degradation[J]. Ann Oncol, 2015, 26(5): 1012-8. doi: 10.1093/annonc/mdv066 [32] 马长顺, 崔世鑫. 周围型非小细胞肺癌CT征象与CD147和血管内皮生长因子-C表达的对照研究[J]. 河北医学, 2017, 23(7): 1077-80. https://www.cnki.com.cn/Article/CJFDTOTAL-HCYX201707007.htm [33] Wu LH, Li J, Ruan XW, et al. Prediction of VEGF and EGFR expression in peripheral lung cancer based on the radiomics model of spectral CT enhanced images[J]. Int J Gen Med, 2022, 15: 6725-38. doi: 10.2147/IJGM.S374002 -

 点击查看大图
计量
- 文章访问数: 61
- HTML全文浏览量: 43
- PDF下载量: 6
- 被引次数: 0