

Value of 99mTc-MIBI SPECT/CT combined with CT imaging features in the diagnosis of primary parathyroid diseases
-
摘要:
目的 探讨SPECT/CT及CT影像学特征在原发性甲状旁腺亢进症(PHPT)影像学定位不准确时的临床价值。 方法 选取90例手术病理证实为PHPT的患者,根据病理结果将其分为漏诊组(n=12)和诊断正确组(n=78);患者共切除110个病灶,按照病理结果分为甲状旁腺病灶组(n=81)和甲状腺病灶组(n=29),在SPECT/CT断层融合图像上的甲状旁腺病灶区、甲状腺病灶区、甲状旁腺病灶对侧正常区勾画大小相同的感兴趣区,并记录上述不同部位的放射性计数,计算靶与非靶比值(T/NT)和靶本比(TBR);在CT病灶截面收集连续3个层面CT密度最大值(CTmax)、最小值(CTmin)及平均值(CTavg)。对各组数据进行组间比较,绘制ROC曲线,评估各项数据的诊断效能。 结果 99mTc-MIBI SPECT/CT图像上,漏诊组病灶的T/NT、TBR、体积、直径均小于诊断正确组,两组间T/NT的差异具有统计学意义(P=0.002)且诊断效能最佳,两组间TBR、体积、直径的差异无统计学意义(P>0.05)。甲状旁腺病灶组和甲状腺病灶组比较中,两组间血钙、血磷的差异无统计学意义(P>0.05),甲状腺病灶组血清甲状旁腺素、TBR、CTmax、CTmin、CTavg均小于甲状旁腺病灶组(P<0.05)。CTmax的诊断效能最优,AUC为0.623,敏感度为74.10%,特异性为62.50%。 结论 SPECT/CT对PHPT进行术前定位时T/NT的诊断效能较TBR更好,可以为PHPT术前定位病灶提供更有价值的参考;与甲状腺病灶进行对TBR、CTmax有较好的临床价值。 -
关键词:
- 原发性甲状旁腺亢进症 /
- SPECT/CT /
- 甲状腺疾病
Abstract:Objective To investigate the clinical value of SPECT/CT and CT imaging features in primary hyperparathyroidism (PHPT) with inaccurate imaging location. Methods A total of 90 patients with PHPT confirmed by surgery and pathology were selected and divided into a missed diagnosis group (n=12) and a correct diagnosis group (n=78) according to pathological results, and a parathyroid lesion group (n=81) and a thyroid lesion group (n=29) according to pathological results. The same size areas of interest were delineated in the focal areas of parathyroid, thyroid and contralateral normal areas of parathyroid lesions on the SPECT/CT fusion images, and the radioactive counts of these different sites were recorded, and target-to-nontarget ratio (T/NT) and target-to- non-target ratio (TBR) were calculated. The mean values of maximum CT density (CTmax), minimum CT density (CTmin) and mean CT density (CTavg) were collected at three consecutive layers. The data of each group were compared between groups, the working curve of subjects was drawn, and the diagnostic efficacy of each data was evaluated. Results On 99mTc-MIBI SPECT/CT images, the T/NT, TBR, volume, and diameter of the lesions in the missed group were smaller than those in the correctly diagnosed group, and the difference in T/NT between the two groups was statistically significant (P=0.002) and the diagnostic efficiency was the best, while there was no significant difference in TBR, volume, and diameter between the two groups (P>0.05). There was no significant difference in blood Ca and blood P between the parathyroid lesion group and the thyroid lesion group(P>0.05). The parathyroid hormone, TBR, CTmax, CTmin and CTavg in the thyroid lesion group were all lower than those in the parathyroid lesion group (P < 0.05). The diagnostic efficiency of CTmax was the best, with AUC of 0.623, sensitivity of 74.10% and specificity of 62.50%. Conclusion SPECT/CT has better diagnostic efficacy than TBR in preoperative localization of PHPT, which can provide more valuable reference for preoperative localization of PHPT. It has good clinical value to treat TBR and CTmax with thyroid lesions. -
Key words:
- primary hyperparathyroidism /
- SPECT/CT /
- thyroid disease
-

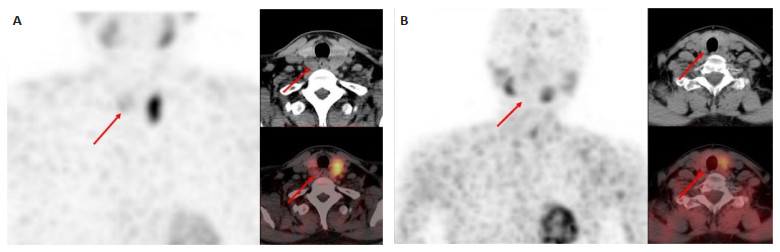
图 1 漏诊组病灶的代表性SPECT/CT图像
Figure 1. Representative SPECT/CT images of lesions in the missed group. A: Adenoma of the inferior parathyroid gland behind the right lobe of the thyroid; B: Adenoma of the inferior parathyroid gland behind the right lobe of the thyroid.

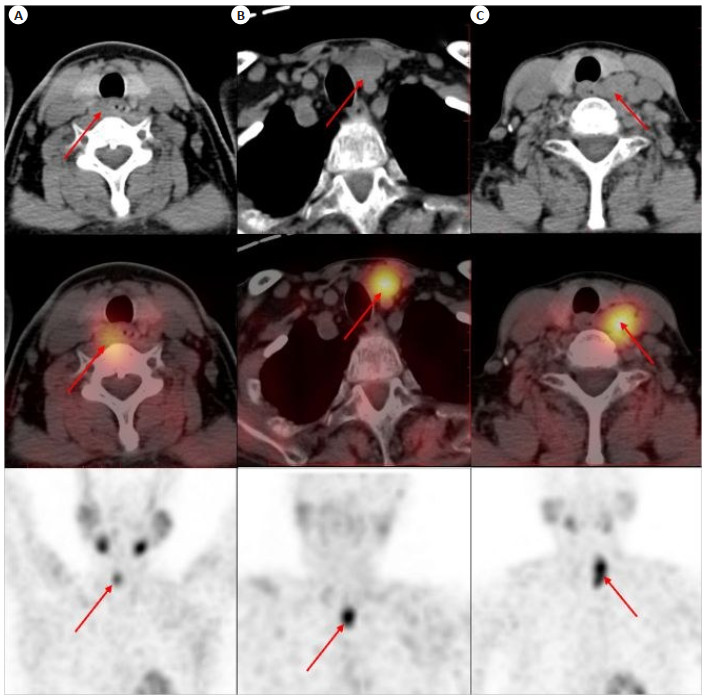
图 2 诊断正确组病灶的代表性SPECT/CT图像
Figure 2. Representative SPECT/CT images of the lesions in the correct group. A: Adenoma of the inferior parathyroid gland behind the right lobe of the thyroid; B: Adenoma of the inferior parathyroid gland behind the left lobe of the thyroid; C: Adenoma of the inferior parathyroid gland behind the left lobe of the thyroid.

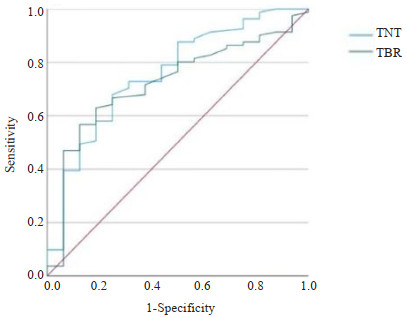
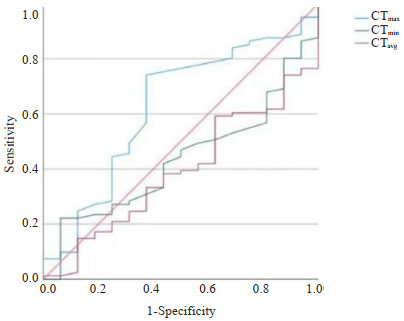
图 4 甲状腺旁腺病灶组和甲状腺病灶组ROC曲线图
Figure 4. ROC curves of parathyroid lesion group and thyroid lesion group.
表 1 两组临床数据分析
Table 1. Clinical data analysis of two groups.
Clinical data analysis of enrolled patients Total(n=90) Missed diagnosis group(n=12) Correct diagnosis group(n=78) t/χ2 P Gender [n(%)] - 0.31 Male 16(17.78) 2(16.60) 14(17.94) Female 74(82.22) 10(62.50) 64(82.05) Clinical data (Mean±SD) Ca(mmol/L) 2.68±0.31 2.61±0.25 2.61±0.25 -1.51 0.13 P(mmol/L) 0.91±0.49 0.97±0.59 0.84±0.35 0.84 0.41 PTH(pg/L) 387.73±402.39 458.27±482.40 315.20±322.35 1.48 0.14 Location [n(%)] 1.12 0.17 Left lower 32(32.98) 5(31.25) 27(33.33) Right lower 35(36.08) 3(39.50) 32(39.50) Left upper 14(14.43) 4(12.34) 10(12.34) Right upper 16(16.49) 4(25.00) 12(14.81) Thyroid disease [n(%)] 0.30 0.58 Yes 27(30.00) 4(33.33) 23(29.48) No 63(70.00) 8(66.67) 55(70.51) Ca:Calcium;P:Phosphorus;PTH:Parathyroid hormone.  下载: 导出CSV
表 2 漏诊组与诊断正确组组间数据分析
Table 2. Data analysis between missed diagnosis group and correct diagnosis group (Mean±SD)
Index Missed diagnosis group(n=12) Correct diagnosis group(n=78) t/χ2 P Radioactive uptake TBR 6.63±7.97 10.86±9.68 -1.641 0.104 T/NT 2.10±1.67 3.85±2.51 -3.488 0.002 Imaging data (Hu) CTmin 19.94±19.28 12.02±30.72 0.990 0.325 CTmax 69.69±21.34 75.33±24.39 -0.862 0.391 CTavg 54.15±21.22 45.58±18.98 1.619 0.109 Tumor lesion Volume (cm3) 2.99±5.12 5.31±8.30 -1.077 0.284 Diameter (cm) 1.87±1.16 2.28±1.21 -1.258 0.211 TBR:Target background ratio;T/NT:Target and non-target ratio.
下载: 导出CSV
表 3 漏诊组和诊断正确组ROC最佳界值表
Table 3. ROC best threshold table for missed and correct diagnosis groups
Radioactive uptake AUC Optimum value Sensitivity Specificity Cut-off T/NT 0.755 0.429 0.679 0.750 2.300 TBR 0.721 0.443 0.568 0.875 7.200
下载: 导出CSV
表 4 是否伴甲状腺疾病对漏诊病灶的分析
Table 4. Analysis of missed lesions with or without thyroid disease [n(%)]
Thyroid disease Missed diagnosis group Correct diagnosis group Total t/χ2 P Yes 5(31.25) 20(24.69) 25(25.77) 0.30 0.58 No 11(68.75) 61(75.31) 61(75.31) Total 16(100.00) 81(100.00) 97(100.00)
下载: 导出CSV
表 5 甲状旁腺病灶组与甲状腺病灶组数据分析
Table 5. Data analysis of parathyroid lesion group and thyroid lesion group (Mean±SD)
Index Thyroid focus group (n=29) Parathyroid focus group (n=81) t/χ2 P Clinical data Ca 2.66±0.25 2.75±0.36 -1.443 0.154 P 0.79±0.17 0.83±0.35 -0.594 0.554 PTH 206.06±130.75 315.20±322.35 -2.522 0.013 Imaging data TBR 4.79±3.89 10.86±9.68 -4.680 <0.001 CTmax 108.79±27.10 75.33±24.39 6.155 <0.001 CTmin 59.83±20.36 12.02±30.72 7.777 <0.001 CTavg 82.58±22.21 45.58±18.98 7.987 <0.001
下载: 导出CSV
表 6 甲状旁腺病灶组和甲状腺病灶组ROC最佳界值表
Table 6. ROC best threshold table for parathyroid and thyroid lesion groups
Imaging data AUC Optimum value Sensitivity Specificity Cut-off CTmax 0.623 0.366 0.741 0.625 63.000 CTmin 0.435 0.160 0.222 0.938 36.000 CTavg 0.392 0.023 0.148 0.875 62.400
下载: 导出CSV
-
[1] Petranović Ovčariček P, Giovanella L, Hindie E, et al. An essential practice summary of the new EANM guidelines for parathyroid imaging[J]. Q J Nucl Med Mol Imaging, 2022, 66(2): 93-103. [2] Zarei A, Karthik S, Chowdhury FU, et al. Multimodality imaging in primary hyperparathyroidism[J]. Clin Radiol, 2022, 77(6): e401-16. doi: 10.1016/j.crad.2022.02.018 [3] Riley K, Anzai Y. Imaging of treated thyroid and parathyroid disease[J]. Neuroimaging Clin N Am, 2022, 32(1): 145-57. doi: 10.1016/j.nic.2021.08.014 [4] Reeder SB, Desser TS, Weigel RJ, et al. Sonography in primary hyperparathyroidism[J]. J Ultrasound Med, 2002, 21(5): 539-52. doi: 10.7863/jum.2002.21.5.539 [5] Zhao W, Lu RG, Yin L, et al. The value of preoperative and intraoperative ultrasound in the localization of intrathyroidal parathyroid adenomas[J]. J Investig Surg, 2022, 35(4): 752-7. doi: 10.1080/08941939.2021.1933273 [6] Carpentier A, Jeannotte S, Verreault J, et al. Preoperative localization of parathyroid lesions in hyperparathyroidism: relationship between technetium 99mMIBI uptake and oxyphil cell content[J]. J Nucl Med, 1998, 39(8): 1441-4. [7] Sankaran SJ, Davidson J. Diagnosis and localization of parathyroid adenomas using 16-slice SPECT/CT: a clinicopathological correlation[J]. J Med Imag Radiat Oncol, 2022, 66(5): 618-22. doi: 10.1111/1754-9485.13330 [8] Pons F, Torregrosa JV, Fuster D. Biological factors influencing parathyroid localization[J]. Nucl Med Commun, 2003, 24(2): 121-4. doi: 10.1097/00006231-200302000-00003 [9] Raruenrom Y, Theerakulpisut D, Wongsurawat N, et al. Diagnostic accuracy of planar, SPECT, and SPECT/CT parathyroid scintigraphy protocols in patients with hyperparathyroidism[J]. Nucl Med Rev, 2018, 21(1): 20-5. doi: 10.5603/NMR.a2018.0003 [10] Ning YL, Chen DF, Huang ZK, et al. Diagnostic value of clinical parameters and parathyroid scintigraphy for asymptomatic primary hyperparathyroidism[J]. Hell J Nucl Med, 2020, 23(2): 148-57. [11] Mariani G, Gulec SA, Rubello D, et al. Preoperative localization and radioguided parathyroid surgery[J]. J Nucl Med, 2003, 44(9): 1443-58. [12] Foster T, Dy B, Rocco R, et al. Routine use of preoperative neck ultrasound in primary hyperparathyroidism identifies coexisting thyroid disease and improves parathyroid localization[J]. Am Surg, 2022, 88(2): 254-9. doi: 10.1177/0003134821991991 [13] Lu RG, Zhao W, Yin L, et al. Efficacy of ultrasonography and Tc-99mMIBI SPECT/CT in preoperative localization of parathyroid adenomas causing primary hyperthyroidism[J]. BMC Med Imag, 2021, 21(1): 87. doi: 10.1186/s12880-021-00616-1 [14] Giovanella L, Bacigalupo L, Treglia G, et al. Will 18F-fluorocholine PET/CT replace other methods of preoperative parathyroid imaging?[J]. Endocrine, 2021, 71(2): 285-97. doi: 10.1007/s12020-020-02487-y [15] Wei WJ, Shen CT, Song HJ, et al. Comparison of SPET/CT, SPET and planar imaging using 99mTc-MIBI as independent techniques to support minimally invasive parathyroidectomy in primary hyperparathyroidism: a meta-analysis[J]. Hell J Nucl Med, 2015, 18(2): 127-35. [16] Wong KK, Fig LM, Gross MD, et al. Parathyroid adenoma localization with 99mTc-sestamibi SPECT/CT: a meta-analysis[J]. Nucl Med Commun, 2015, 36(4): 363-75. doi: 10.1097/MNM.0000000000000262 [17] Treglia G, Sadeghi R, Schalin-Jäntti C, et al. Detection rate of (99m) Tc-MIBI single photon emission computed tomography (SPECT)/CT in preoperative planning for patients with primary hyperparathyroidism: a meta-analysis[J]. Head Neck, 2016, 38(Suppl 1): E2159-72. [18] Cordes M, Dworak O, Papadopoulos T, et al. MIBI scintigraphy of parathyroid adenomas: correlation with biochemical and histological markers[J]. Endocr Res, 2018, 43(3): 141-8. doi: 10.1080/07435800.2018.1437747 [19] Erbil Y, Kapran Y, İşsever H, et al. The positive effect of adenoma weight and oxyphil cell content on preoperative localization with 99mTc-sestamibi scanning for primary hyperparathyroidism[J]. Am J Surg, 2008, 195(1): 34-9. doi: 10.1016/j.amjsurg.2007.01.040 [20] Westreich RW, Brandwein M, Mechanick JI, et al. Preoperative parathyroid localization: correlating false-negative technetium 99m sestamibi scans with parathyroid disease[J]. Laryngoscope, 2003, 113(3): 567-72. doi: 10.1097/00005537-200303000-00032 [21] Silov G, Erdogan Ozbodur S. The relationship between planar and SPECT/CT parameters and functional markers in primary hyperparathyroidism[J]. Diagnostics, 2023, 13(20): 3182. doi: 10.3390/diagnostics13203182 [22] Marmin C, Toledano M, Lemaire S, et al. Computed tomography of the parathyroids: the value of density measurements to distinguish between parathyroid adenomas of the lymph nodes and the thyroid parenchyma[J]. Diagn Interv Imag, 2012, 93(7/8): 597-603. [23] Guo R, Wang JQ, Zhang M, et al. Value of 99mTc-MIBI SPECT/CT parathyroid imaging and ultrasonography for concomitant thyroid carcinoma[J]. Nucl Med Commun, 2017, 38(8): 676-82. doi: 10.1097/MNM.0000000000000692 [24] Parikshak M, Castillo ED, Conrad MF, et al. Impact of hypercalcemia and parathyroid hormone level on the sensitivity of preoperative sestamibi scanning for primary hyperparathyroidism [J]. Am Surg, 2003, 69(5): 393-9. doi: 10.1177/000313480306900507 [25] Vestergaard S, Gerke O, Bay M, et al. Head-to-head comparison of Tc-99m-sestamibi SPECT/CT and C-11-L-methionin PET/CT in parathyroid scanning before operation for primary hyperparathyroidism[J]. Mol Imag Biol, 2023, 25(4): 720-6. doi: 10.1007/s11307-023-01808-7 [26] Komek H, Yilmaz EE, Cakabay B, et al. Contrast enhanced 99mTcMIBI SPECT/CT in primary hyperparathyroidism[J]. Ann Italiani Di Chir, 2018, 89: 379-84. -

 点击查看大图
计量
- 文章访问数: 90
- HTML全文浏览量: 31
- PDF下载量: 16
- 被引次数: 0