

MRI features of atypical enhanced primary hepatocellular carcinoma
-
摘要:
目的 分析不典型强化的原发性肝细胞癌(HCC)的MRI影像学特征,提高不典型强化HCC的诊出率。 方法 回顾性纳入2019~2021年于深圳市人民医院行MRI检查并经病理证实的142例HCC患者,按照MRI诊断方式将患者分为两组:符合“快进快出”为典型强化组(n=97),不符合“快进快出”为不典型强化组(n=45)。由2位影像医师分别阅片并记录肿瘤的强化方式、瘤体直径、非边缘动脉期强化、强化包膜、非边缘强化洗褪、晕状强化、瘤内脂肪或出血、瘤内结节、马赛克征、肿瘤的对血管的浸润、动脉期病灶信号强度、门脉期病灶信号强度、表观弥散系数值及门脉期强化率。对单因素分析有统计学意义的资料纳入多因素Logistic回归分析,建立不典型强化HCC的诊断模型。绘制ROC曲线,计算曲线下面积,评估判定模型的敏感度与特异性。 结果 两组间非边缘动脉期强化、强化包膜、肿块内脂肪、出血、结中结、马赛克征、血管浸润、肿瘤直径及表观弥散系数的差异无统计学意义(P>0.05),而非边缘强化洗褪(P=0.005)、晕状强化(P=0.005)以及门脉期强化率(P=0.001)的差异有统计学意义。将上述3种差异有统计学意义的变量纳入多因素Logistic回归分析显示:缺乏非边缘强化洗褪征象(OR=27.995,95% CI:3.910~200.462,P=0.001)和门脉期强化率(OR=1.034,95% CI:1.018~1.051,P < 0.001)是HCC发生不典型强化的独立影响因素。进一步基于非边缘强化洗褪和门脉期强化率,建立联合判定模型,ROC曲线分析显示非边缘强化洗褪以及门脉期强化率联合观察对不典型强化HCC具有较好的判定效能(曲线下面积为0.874)。 结论 晕状强化、门脉期强化率及缺乏非边缘强化洗褪与HCC发生不典型强化具有相关性,而门脉期强化率和缺乏非边缘强化洗褪特征则是HCC发生不典型强化的独立影响因素,两者联合有助于判定不典型HCC。 Abstract:Objective To analyze the MRI features and improve the diagnostic rate of atypical enhanced primary hepatocellular carcinoma (HCC). Methods A total of 142 patients with pathologically confirmed HCC at Shenzhen People's Hospital from 2019 to 2021, who concurrently received preoperative contrast-enhanced MRI examination, were included in this retrospective study. Patients were divided into two groups based on MRI features: Typical enhancement group (n=97, those who met the "fast in and fast out" criteria) and atypical enhancement group (n=45, those who did not meet the "fast in and fast out" criteria). A series of imaging parameters, including enhancement pattern, tumor diameter, non- rim arterial phase enhancement, enhancement capsule, non-rim washout, halo enhancement, intratumoral fat or bleeding, intratumoral nodules, mosaic sign, tumor infiltration into blood vessels, lesion signal intensity on arterial phase, lesion signal intensity on portal phase, apparent diffusion coefficient, and portal phase enhancement rate, were independently assessed by two expert radiologists. Variables with statistical significance in the univariate analysis were further incorporated in the multivariate Logistic regression model to establish a prediction model for identifying atypical enhanced HCC. The ROC curve was used to evaluate the sensitivity and specificity of the prediction model. Results There was no significant difference between the two groups in non- rim arterial phase enhancement, enhanced capsule, intratumoral fat or bleeding, intratumoral nodules, mosaic sign, vascular infiltration, tumor diameter and apparent diffusion coefficient value (P>0.05), while there were statistical differences in non-rim washout (P=0.005), halo enhanced (P=0.005) and portal phase enhanced rate (P=0.001). Multivariate logistic regression analysis showed that the absence of non- rim washout (OR=27.995, 95% CI: 3.910- 200.462, P=0.001) and portal phase enhancement rate (OR=1.034, 95% CI: 1.018-1.051, P < 0.001) were independent influencing factors for atypical enhancement in HCC. A combined prediction model was established based on the non-rim washout and portal phase enhancement rate. ROC analysis showed that the prediction ability of the combined observation (non- rim washout plus portal phase enhancement rate) for atypical enhanced HCC was overall satisfying with the AUC of 0.874. Conclusion Non-rim washout enhancement and portal venous phase enhancement rate are independent influencing factors for atypical enhancement HCC, and the combination of these two parameters can improve the diagnostic efficacy of HCC. -

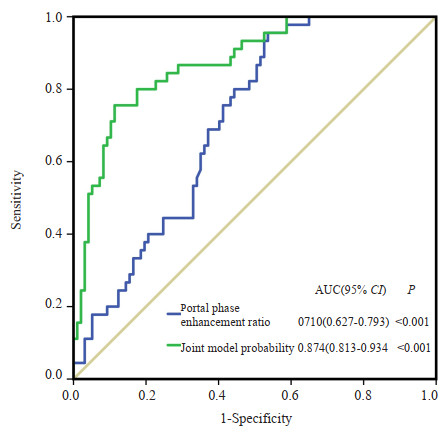
图 1 MRI动态增强扫描不典型强化HCC判定效能ROC曲线
Figure 1. ROC curves for evaluating the prediction performance of atypical enhancing HCC. Using the "absence of non-rim washout sign" and "portal phase enhancement rate" for bivariate joint determination, the prediction model could be concluded: Probability for atypical enhancement = e-5.846+3.153×absence of non-rim washout+0.033×portal phase enhancement rate/(1+e-5.846+3.153×absence of non-rim washout +0.033×portal phase enhancement rate). If the probability of atypical enhancement > 0.5, it was determined as the atypical enhancement group.

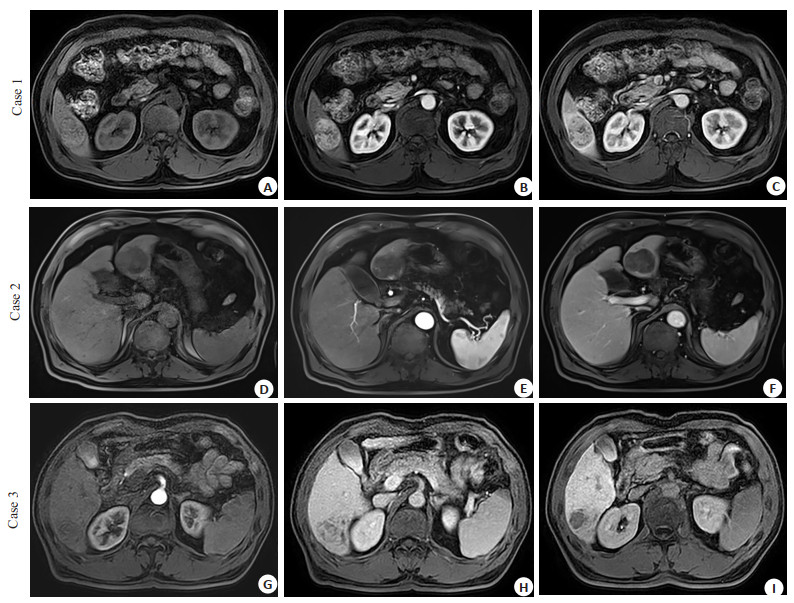
图 2 不典型强化HCC的MRI影像图
Figure 2. MRI of atypical enhanced primary HCC. A: T1WI showed a single HCC lesion with equal signal intensity for case 1, a 56-year-old male; B: Arterial phase image showed the HCC lesion with uneven enhancement for case 1; C: Portal phase image showed the HCC lesion with prominent peripheral enhancement and a typical halo enhancement sign for case 1. D: T1WI image appeared an HCC lesion with low signal intensity for case 2, a 63-year-old male; E: Arterial phase exhibited the HCC lesion with only nodular enhancement at the peripheral area, while the majority of lesion lacked enhancement for case 2; F: Portal phase showed the HCC lesion with peripheral enhancement attenuation, while the majority of the lesion remains unenhanced, "non-rim washout" was absent throughout the scan for case 2. G: Arterial phase image showed an HCC lesion with no enhancement for case 3, a 57-year-old male; H: Portal phase image appeared the HCC lesion with uneven enhancement, and the signal intensity was higher than that on arterial phase for case 3; I: Delayed phase image presented the HCC lesion with signal intensity decreased and an elevated portal phase enhancement rate for case 3.
表 1 两组间HCC患者的MRI征象资料比较
Table 1. MRI characteristics in HCC patients between the two groups
MRI imaging features Atypical enhancement group (n=45) Typical enhancement group (n=97) Z/χ2 P Non-rim arterial phase enhancement [n(%)] 40 (88.9) 79 (81.4) 1.255 0.263 Enhancing capsule [n(%)] 33 (73.3) 75(77.3) 0.268 0.605 Non-rim washout [n(%)] 15 (33.3) 84 (86.6) 7.714 0.005 Halo enhancement [n(%)] 13 (28.9) 10 (10.3) 7.818 0.005 Intratumoral fat [n(%)] 6 (13.3) 9 (9.3) 0.192 0.661 Intratumoral bleeding [n(%)] 6 (13.3) 21 (21.6) 1.381 0.240 Intratumoral nodules [n(%)] 0 (0) 7 (7.2) 3.178 0.102 Mosaic sign [n(%)] 10 (22.2) 27 (27.8) 0.503 0.478 Tumor infiltration into blood vessels [n(%)] 3 (6.7) 7 (7.2) 0.014 0.905 Tumor diameter [mm, M(P25, P75)] 41 (26.0, 53.5) 46 (24.0, 73.5) 1.239 0.215 Apparent diffusion coefficient [10-3mm2/s, M(P25, P75)] 0.719 (0.104, 1.0465) 0.699 (0.113, 0.898) 0.480 0.631 Portal phase enhancement rate[%, M(P25, P75)] 21.29 (7.82, 43.10) 2.65(-14.28, 26.22) 4.023 0.001  下载: 导出CSV
表 2 MRI动态增强扫描不典型强化HCC的多因素Logistic回归分析
Table 2. Logistic regression analysis for atypical enhancement HCC in MRI
Variables β SE Wald OR (95% CI) P Non-rim washout 3.332 1.004 11.003 27.995 (3.910-200.462) 0.001 Absence, 1 Presence, 0 Portal phase enhancement rate 0.034 0.008 17.612 1.034 (1.018-1.051) < 0.001 Halo enhancement 0.199 0.943 0.045 1.220 (0.192-7.748) 0.833 Presence, 1 Absence, 0
下载: 导出CSV
表 3 MRI动态增强扫描不典型强化HCC的判定模型的建立
Table 3. Establishment of prediction model for atypical enhanced HCC in MRI
Variables β SE Wald OR (95% CI) P Non-rim washout 3.153 0.531 35.238 23.412 (8.266-66.313) < 0.001 Absence, 1 Presence, 0 Portal phase enhancement rate 0.033 0.008 17.770 1.034 (1.018-1.050) < 0.001 Constant -5.846 0.911 41.192 0.003 (-) < 0.001
下载: 导出CSV
-
[1] 马慧, 王莉, 孙之, 等. 基于临床指标和钆贝葡胺增强MRI列线图预测肝细胞癌GPC-3表达的研究[J]. 中华放射学杂志, 2022, 56(11): 1230-6. [2] Xie DY, Zhu K, Ren ZG, et al. A review of 2022 Chinese clinical guidelines on the management of hepatocellular carcinoma: updates and insights[J]. Hepatobiliary Surg Nutr, 2023, 12(2): 216-28. doi: 10.21037/hbsn-22-469 [3] Polyzos SA, Chrysavgis L, Vachliotis ID, et al. Nonalcoholic fatty liver disease and hepatocellular carcinoma: insights in epidemiology, pathogenesis, imaging, prevention and therapy[J]. Semin Cancer Biol, 2023, 93: 20-35. doi: 10.1016/j.semcancer.2023.04.010 [4] 岳茜, 陈娇, 何淼, 等. MRI纹理分析在肝癌中的应用[J]. 实用放射学杂志, 2019, 35(11): 1856-8, 1877. doi: 10.3969/j.issn.1002-1671.2019.11.035 [5] Chartampilas E, Rafailidis V, Georgopoulou V, et al. Current imaging diagnosis of hepatocellular carcinoma[J]. Cancers, 2022, 14(16): 3997. doi: 10.3390/cancers14163997 [6] Rhee H, Cho ES, Nahm JH, et al. Gadoxetic acid-enhanced MRI of macrotrabecular-massive hepatocellular carcinoma and its prognostic implications[J]. J Hepatol, 2021, 74(1): 109-21. doi: 10.1016/j.jhep.2020.08.013 [7] Singal AG, Llovet JM, Yarchoan M, et al. AASLD practice guidance on prevention, diagnosis, and treatment of hepatocellular carcinoma[J]. Hepatology, 2023: DOI: 10.1097/HEP.0000000000000466. [8] Di Martino M, Anzidei M, Zaccagna F, et al. Qualitative analysis of small (≤2 cm) regenerative nodules, dysplastic nodules and well-differentiated HCCs with gadoxetic acid MRI[J]. BMC Med Imaging, 2016, 16(1): 62. doi: 10.1186/s12880-016-0165-5 [9] 盛静, 肖运平. 原发性肝细胞癌CT、MRI不典型影像表现及原因分析[J]. 实用放射学杂志, 2021, 37(2): 239-42. [10] 张志平, 陈飞, 戴真煜, 等. 肝细胞癌综合治疗后复发的小肝癌患者MRI平扫和动态增强各序列图像表现分析[J]. 医学影像学杂志, 2018, 28(11): 1868-71. https://www.cnki.com.cn/Article/CJFDTOTAL-XYXZ201811030.htm [11] 黄梦娜. 磁共振不同扩散模型对小肝癌和肝硬化结节的诊断价值评估[D]. 郑州: 郑州大学, 2018. [12] Li JF, Wang JM, Lei LP, et al. The diagnostic performance of gadoxetic acid disodium-enhanced magnetic resonance imaging and contrast-enhanced multi-detector computed tomography in detecting hepatocellular carcinoma: a meta-analysis of eight prospective studies[J]. Eur Radiol, 2019, 29(12): 6519-28. doi: 10.1007/s00330-019-06294-6 [13] 刘明明, 顾世民, 孙妤, 等. 乙肝背景下不典型小肝细胞癌的MRI影像学特点[J]. 实用放射学杂志, 2022, 38(11): 1807-10. [14] Song M, Park HJ, Lee ES, et al. Value of precontrast and portal venous phases for evaluating atypical hepatocellular carcinoma mimicking arterioportal shunt[J]. Eur J Radiol, 2021, 143: 109933. doi: 10.1016/j.ejrad.2021.109933 [15] 杨健, 柏玉涵, 时昭红, 等. Gd-EOB-DTPA多模态MRI对常规MRI不典型强化肝硬化结节的诊断价值[J]. 中国医学影像学杂志, 2019, 27(9): 695-9. https://www.cnki.com.cn/Article/CJFDTOTAL-ZYYZ201909018.htm [16] 吕蓉, 胡维娟. 肝脏影像报告和数据系统肝癌MRI辅助征象解析[J]. 放射学实践, 2020, 35(10): 1329-34. https://www.cnki.com.cn/Article/CJFDTOTAL-FSXS202010029.htm [17] Son J, Hwang SH, Park S, et al. Imaging features of hepatocellular carcinoma[J]. Investig Radiol, 2019, 54(8): 494-9. [18] 邢飞, 朱文静, 杜圣, 等. 非动脉期高强化的肝胆期"甜甜圈" 样高信号结节的影像及临床病理学特征[J]. 临床放射学杂志, 2022, 41(9): 1688-92. https://www.cnki.com.cn/Article/CJFDTOTAL-LCFS202209017.htm [19] Jeon SK, Joo I, Lee DH, et al. Combined hepatocellular cholangiocarcinoma: LI-RADS v2017 categorisation for differential diagnosis and prognostication on gadoxetic acid-enhanced MR imaging[J]. Eur Radiol, 2019, 29(1): 373-82. [20] 李炳荣, 张坤, 严小斌, 等. 2018版MRI肝脏影像报告和数据系统对≤3 cm肝细胞癌与其他肝脏原发恶性肿瘤的鉴别诊断价值[J]. 中华放射学杂志, 2021, 55(2): 166-72. https://www.cnki.com.cn/Article/CJFDTOTAL-WZYX202203007.htm [21] Kulkarni NM, Fung A, Kambadakone AR, et al. Computed tomography techniques, protocols, advancements, and future directions in liver diseases[J]. Magn Reson Imaging Clin N Am, 2021, 29(3): 305-20. [22] Inchingolo R, Maino C, Gatti M, et al. Gadoxetic acid magnetic-enhanced resonance imaging in the diagnosis of cholangiocarcinoma[J]. World J Gastroenterol, 2020, 26(29): 4261-71. [23] Wang SY, Yin L, Wang C, et al. Atypical magnetic resonance imaging features and differential diagnosis of hepatocellular carcinoma[J]. J Int Med Res, 2020, 48 (10): 300060520943415. [24] Mao YF, Wang JC, Zhu Y, et al. Gd-EOB-DTPA-enhanced MRI radiomic features for predicting histological grade of hepatocellular carcinoma[J]. Hepatobiliary Surg Nutr, 2022, 11(1): 13-24. [25] Duncan JK, Ma N, Vreugdenburg TD, et al. Gadoxetic acid-enhanced MRI for the characterization of hepatocellular carcinoma: a systematic review and meta-analysis[J]. J Magn Reson Imaging, 2017, 45(1): 281-90. [26] Chou CK, Chou SC. Necrotizing granulomatous inflammation of the liver[J]. Radiol Case Rep, 2016, 11(3): 157-60. -

 点击查看大图
计量
- 文章访问数: 107
- HTML全文浏览量: 24
- PDF下载量: 15
- 被引次数: 0