


Correlation between the expression of Ki-67 in lung cancer and CT signs and quantitative parameters
-
摘要:
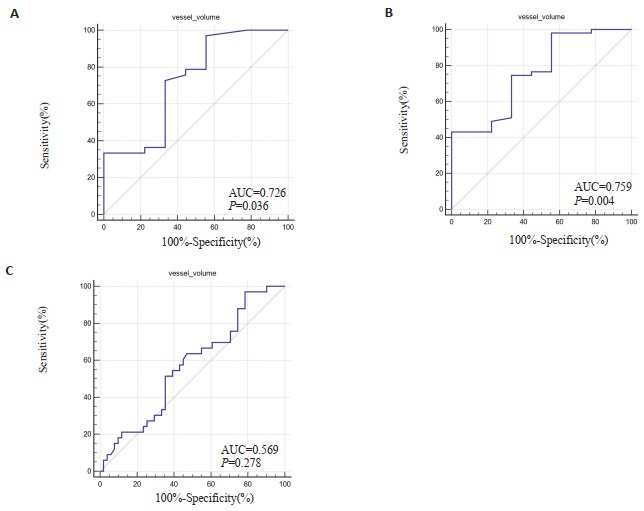
目的 探讨肺癌CT征象及定量参数与Ki-67抗原表达水平的相关性。 方法 回顾性分析我院93例行CT扫描且经病理证实的肺癌患者的临床及影像资料,采用能谱CT进行常规平扫,肿瘤标本行免疫组化染色,检测Ki-67抗原表达水平,观察肺癌CT影像征象。采用计算机辅助诊断软件对原发肺癌进行勾勒、分割,记算CT定量参数。分析Ki-67表达水平与CT征象及定量参数之间的相关性,并绘制ROC曲线分析CT影像征象及定量参数对Ki-67表达水平的预测效能。 结果 Ki-67表达水平与性别及病理类型相关(P < 0.05),男性、肺鳞癌Ki-67表达指数更高;Ki-67表达水平与CT各影像征象无相关性(P > 0.05);肿瘤血管体积在Ki-67不同表达组之间的差异有统计学意义(P < 0.05);Spearman非参数相关性分析显示血管体积与Ki-67表达水平呈正相关关系(r=0.224,P=0.03),ROC曲线下面积在低中水平、低高水平、中高水平间分别为0.726、0.759、0.569。 结论 CT定量参数(血管体积)可用于评估肺癌Ki-67表达水平,且与Ki-67表达水平呈正相关关系,在一定程度上可以协助临床评估肺癌患者肿瘤细胞增殖活性。 Abstract:Objective To explore the correlation between CT signs and quantitative parameters of lung cancer and the expression level of Ki-67 antigen. Methods Clinical and imaging data of 93 patients with lung cancer confirmed by pathology who underwent CT scan in our hospital were retrospectively analyzed. Routine CT scan was performed using spectral CT, and tumor specimens were subjected to immunohistochemical staining to detect the expression level of Ki-67 antigen. CT signs of lung cancer were observed. Computer-aided diagnosis software was used to delineate and segment the primary lung cancer, and CT quantitative parameters were calculated. The correlation between Ki-67 expression level and CT signs and quantitative parameters was analyzed. ROC curve was drawn to analyze the predictive efficacy of CT signs and quantitative parameters on Ki-67 expression level. Results The expression level of Ki-67 was related to gender and pathological type(P < 0.05), with higher expression index in males and lung squamous cell carcinoma. There was no correlation between the expression level of Ki-67 and various CT signs(P > 0.05). The difference in tumor vascular volume between different Ki-67 expression groups was statistically significant (P < 0.05). Spearman non-parametric correlation analysis showed a positive correlation between vascular volume and Ki-67 expression level (r=0.224, P=0.03). The area under curves were 0.726, 0.759, and 0.569 in the low-medium level, low-high level, and medium-high level, respectively. Conclusion CT quantitative parameters (vascular volume) can be used to evaluate the expression level of Ki-67 in lung cancer. They are positively correlated with Ki-67 expression level. They can assist in the clinical evaluation of tumor cell proliferation activity in patients with lung cancer to a certain extent. -
Key words:
- lung cancer /
- Ki-67 /
- computer tomography /
- image signs /
- quantitative parameters
-

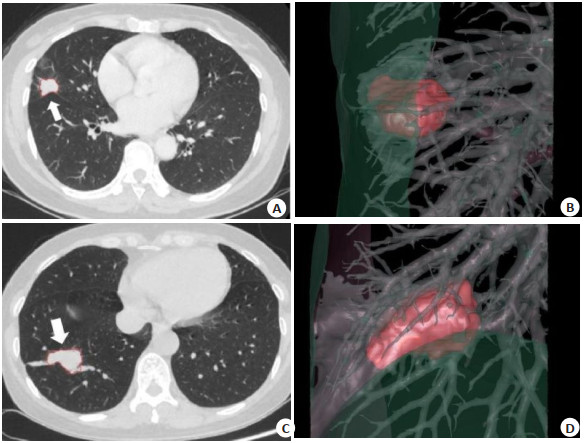
图 1 肺结节分割结果及三维关系显示
Figure 1. Pulmonary nodule segmentation results and three-dimensional relationship display.
A-B: Female, 54-year-old with adenocarcinoma in the outer segment of the right middle lobe of the lung, with a Ki-67 expression level of 5%. A: CT scan image showed the automatically segmented nodule; B: Three-dimensional display of the nodule position and its relationship with bronchi and blood vessels. The volume was 3.01 mL, the average density was -36.66 Hu, the surface area was 12.6 cm2, the maximum diameter was 2.44 cm, the average diameter was 1.87 cm, there were 14 visible blood vessels, the vascular volume was 1.19 mL, the mean vascular density was -547.13 Hu, with the LAA 950% 0.13. C-D: Female, 57-year-old with squamous cell carcinoma in the outer lower segment of the right lung, with a Ki-67 expression level of 80%. C: CT scan image showed the automatically segmented nodule; D: Three-dimensional display of the nodule position and its relationship with bronchi and blood vessels. The volume was 6.72 mL, the average density was -44.98 Hu, the surface area was 22.84 cm2, the maximum diameter was 3.52 cm, the average diameter was 2.73 cm, there were 18 visible blood vessels, the vascular volume was 1.67 mL, the mean vascular density was -491.99 Hu, with the LAA 950% 0.77.

图 2 血管体积在鉴别3组Ki-67不同表达水平的ROC曲线
Figure 2. The ROC curve of vessel volume in identifying different expression levels of Ki-67 in three groups.
A: Low-expression group vs medium-expression group; B: Low-expression group vs high-expression group; C: Medium-expression group vs high-expression group.
表 1 各组临床资料比较
Table 1. Comparison of baseline data between groups [n(%)]
Clinical data Low expression(n=9) Medium expression(n=33) High expression(n=51) χ2/t P Age(years, Mean±SD) 58.33±8.97 63.52±10.69 63.93±9.97 1.119 0.331 Gender 8.594 0.014 Male 1(11.1) 20(60.6) 32(62.7) Female 8(88.9) 13(39.4) 19(37.3) Pathological type 8.817 0.033 Adenocarcinoma 8(88.9) 31(93.9) 35(68.6) Squamous cell carcinoma 1(11.1) 1(3.0) 12(23.5) Small cell carcinoma 0 1(3.0) 4(7.8) Clinical stage 11.398 0.077 Ⅰ 2(22.2) 0 2(3.9) Ⅱ 0 2(6.1) 1(2.0) Ⅲ 0 7(21.2) 10(19.6) Ⅳ 7(77.8) 24(72.7) 38(74.5) Smoking history 3.709 0.157 No 8(88.9) 19(57.6) 28(54.9) Yes 1(11.1) 14(42.4) 23(45.1)  下载: 导出CSV
表 2 各组间CT征象比较
Table 2. Comparison of CT signs between groups (n)
CT signs Total(n=93) Ki-67 χ2 P Low expression(n=9) Medium expression(n=33) High expression(n=51) Lobulation(No/Yes) 15/78 1/8 4/29 10/41 0.851 0.766 Spiculation(No/Yes) 22/71 1/8 8/25 13/38 0.679 0.819 Pleural indentation(No/Yes) 40/53 5/4 17/16 18/33 2.829 0.235 Vacuole sign(No/Yes) 74/19 7/2 28/5 39/12 0.972 0.638 Bronchograms(No/Yes) 69/24 7/2 25/8 37/14 0.188 0.939 Necrosis(No/Yes) 72/21 8/1 26/7 38/13 0.73 0.765 Calcification(No/Yes) 82/11 9/0 30/3 43/8 1.482 0.510 Bronchial truncation(No/Yes) 30/63 4/5 11/22 15/36 0.958 0.642 Vessel convergence(No/Yes) 56/37 4/5 21/12 31/20 1.148 0.608 Lymphadenectasis(No/Yes) 25/68 5/4 6/27 14/37 4.717 0.084 Pleural effusion(No/Yes) 56/37 7/2 20/13 29/22 1.295 0.523
下载: 导出CSV
表 3 各组间CT定量参数比较
Table 3. Comparison of CT quantitative parameters between groups (Mean±SD)
CT quantitative parameters Low expression(n=9) Medium expression(n=33) High expression(n=51) H P Volume(mL) 44.67±64.33 26.36±28.30 33.79±34.49 1.52 0.47 Mean density(Hu) 52.18±119.26 12.73±43.53 19.91±50.11 0.85 0.65 Surface area(cm2) 74.51±70.31 60.61±50.03 70.84±47.17 1.61 0.45 Maximum diameter(cm) 4.44±1.70 4.45±1.85 4.78±1.52 1.87 0.39 Mean diameter(cm) 3.05±1.81 3.14±1.47 3.17±1.45 0.36 0.84 Total number of vessels in the visual field(mL) 11.56±9.22 20.85±12.93 21.29±14.52 4.18 0.12 Vessel volume(mL) 1.20±0.97 2.34±1.70 3.03±2.43 6.87 0.03 Mean vessel density(Hu) 519.03±35.59 497.16±47.18 507.07±47.77 1.63 0.44 LAA 950% 4.71±9.11 4.08±7.85 5.30±9.29 1.51 0.47 LAA: Low-attenuation area; LAA950%: LAA 950% was defined as the percentage of the volume of the low-attenuation area of the lung below -950 Hu to the total volume of the low-attenuation area of the lung.
下载: 导出CSV
-
[1] Sung H, Ferlay J, Siegel RL, et al. Global cancer statistics 2020: GLOBOCAN estimates of incidence and mortality worldwide for 36 cancers in 185 countries[J]. CA Cancer J Clin, 2021, 71(3): 209-49. doi: 10.3322/caac.21660 [2] Bade BC, Dela Cruz CS. Lung cancer 2020: epidemiology, etiology, and prevention[J]. Clin Chest Med, 2020, 41(1): 1-24. doi: 10.1016/j.ccm.2019.10.001 [3] Gu Q, Feng Z, Liang Q, et al. Machine learning-based radiomics strategy for prediction of cell proliferation in non-small cell lung cancer[J]. Eur J Radiol, 2019, 118: 32-7. doi: 10.1016/j.ejrad.2019.06.025 [4] 赵恒亮, 孟闫凯, 窦沛沛, 等. 双能量CT预测肺癌Ki-67、TTF-1表达的价值[J]. 临床放射学杂志, 2021, 40(8): 1505-9. https://www.cnki.com.cn/Article/CJFDTOTAL-LCFS202108014.htm [5] 杨新蕊, 闫呈新, 朱建忠. 周围型肺癌CT征象与Ki-67、TTF-1、p63表达的相关性分析[J]. 现代肿瘤医学, 2021, 29(18): 3204-9. https://www.cnki.com.cn/Article/CJFDTOTAL-SXZL202118015.htm [6] 李文文, 王辉. 关于肺腺癌HRCT形态学征象与病理进展类型及Ki67、p53表达的相关性研究[J]. 影像研究与医学应用, 2017, 1(3): 50-3. https://www.cnki.com.cn/Article/CJFDTOTAL-YXYY201703030.htm [7] 田双凤, 杨萌, 夏建国, 等. 实性肺癌能谱CT参数与Ki-67表达水平的相关性研究[J]. 影像诊断与介入放射学, 2021, 30(1): 20-4. https://www.cnki.com.cn/Article/CJFDTOTAL-YXZD202101005.htm [8] 王广丽, 史浩, 张成琪, 等. 非小细胞肺癌MVD及Ki-67表达与CT能谱成像的相关性研究[J]. 医学影像学杂志, 2017, 27(3): 461-4. https://www.cnki.com.cn/Article/CJFDTOTAL-XYXZ201703020.htm [9] 田双凤, 杨萌, 夏建国, 等. 实性非小细胞肺癌能谱CT参数与Ki-67表达水平的相关性研究[J]. 中国临床医学影像杂志, 2021, 32(3): 181-4, 194. https://www.cnki.com.cn/Article/CJFDTOTAL-LYYX202103009.htm [10] Folescu R, Levai CM, Grigoraş ML, et al. Expression and significance of Ki-67 in lung cancer[J]. Rom J Morphol Embryol, 2018, 59(1): 227-33. [11] 陈佳莉, 冯琨, 刘晓雯, 等. 非小细胞肺癌CT灌注参数与VEGF、HIF-1α、Ki-67的相关性研究[J]. 放射学实践, 2021, 36(7): 857-62. https://www.cnki.com.cn/Article/CJFDTOTAL-FSXS202107013.htm [12] 程子珊, 李圣磊, 李文武, 等. 能谱CT多参数定量分析鉴别肺癌病理类型的应用价值[J]. 中华肿瘤防治杂志, 2022, 29(1): 59-65. https://www.cnki.com.cn/Article/CJFDTOTAL-QLZL202201009.htm [13] 胡蓉, 徐耀, 侯金鹏, 等. 能谱CT多参数定量分析对鉴别肺癌病理类型的价值[J]. 实用放射学杂志, 2019, 35(3): 464-8. https://www.cnki.com.cn/Article/CJFDTOTAL-QLZL202201009.htm [14] 黄亚男, 赵振华, 毛海佳, 等. 不同病理类型肺癌磁共振定量灌注直方图参数、表观扩散系数与Ki-67相关性分析[J]. 中华医学杂志, 2019, 99(21): 1645-50. https://cdmd.cnki.com.cn/Article/CDMD-10335-1019256976.htm [15] Nasim F, Sabath BF, Eapen GA. Lung cancer[J]. Med Clin N Am, 2019, 103(3): 463-73. [16] 郭丽娟, 张会杰, 赵志勇, 等. Ⅰ期肺腺癌18F-FDG PET/CT表现与Ki-67表达的相关性[J]. 中国医学影像技术, 2021, 37(1): 71-5. https://www.cnki.com.cn/Article/CJFDTOTAL-ZYXX202101017.htm [17] Vesselle H, Salskov A, Turcotte E, et al. Relationship between non-small cell lung cancer FDG uptake at PET, tumor histology, and ki-67 proliferation index[J]. J Thorac Oncol, 2008, 3(9): 971-8. [18] Okada M, Nishio W, Sakamoto T, et al. Effect of tumor size on prognosis in patients with non-small cell lung cancer: the role of segmentectomy as a type of lesser resection[J]. J Thorac Cardiovasc Surg, 2005, 129(1): 87-93. [19] 吴志涛, 上官伦, 徐冰洁. 周围型肺癌CT征象与Ki-67、p53表达的关系[J]. 分子影像学杂志, 2023, 46(1): 124-8. doi: 10.12122/j.issn.1674-4500.2023.01.24 [20] 任占丽, 张喜荣, 贾永军, 等. 基于CT图像特征预测肺腺癌Ki-67表达水平的可行性研究[J]. 医疗卫生装备, 2021, 42(8): 53-7. https://www.cnki.com.cn/Article/CJFDTOTAL-YNWS202108012.htm [21] 周洁, 谭理连, 陈淮, 等. 周围型肺癌CT表现、病理与Ki-67、p53相关性研究[J]. 实用放射学杂志, 2011, 27(2): 185-90, 210. https://www.cnki.com.cn/Article/CJFDTOTAL-JYYL201401013.htm [22] 邢庆娜, 张小安, 赵鑫, 等. 子宫内膜癌MRI征象与血管内皮生长因子、Ki-67表达的相关性研究[J]. 中国医学影像学杂志, 2011, 19(9): 688-92. https://www.cnki.com.cn/Article/CJFDTOTAL-ZYYZ201109019.htm -

 点击查看大图
计量
- 文章访问数: 106
- HTML全文浏览量: 96
- PDF下载量: 8
- 被引次数: 0