


An unenhanced CT radiomics model using differential network analysis could predict and explain WHO/ISUP grade of clear cell renal cell carcinoma effectively
-
摘要:
目的 探讨基于差异化网络分析特征选择的CT影像组学模型预测肾透明细胞癌世界卫生组织/国际泌尿病理学会(WHO/ISUP)核分级的可行性,以及探讨模型特征的可解释性。 方法 回顾性分析175例肾透明细胞癌患者的CT图像以及临床病理资料,其中训练集105例,测试集70例。使用ITK-SNAP和PyRadiomics软件平台对肿瘤的图像进行分割和特征提取。在训练集中,通过差异化网络分析进行特征选择,并构建不同期相的WHO/ISUP核分级预测模型。选择性能最佳的期相模型,并与其他机器学习模型和临床模型比较检验其性能。通过K-M生存分析、Cox回归分析以及风险评分,对最佳期相模型中的特征进行重要性评估,以验证其可解释性。 结果 平扫期模型的预测效能最好,验证集中的曲线下面积均为0.76,优于其他机器学习模型以及临床模型(P < 0.05)。K-M生存分析、Cox回归分析以及风险评分分析结果均显示平扫期模型中的影像组学特征可预测无进展生存期。 结论 基于差异化网络分析特征选择构建的平扫期模型不仅可以有效预测肾透明细胞癌的WHO/ISUP核分级,同时该模型的特征也能很好的预测无进展生存期,有较强的可解释性。 -
关键词:
- 肾透明细胞癌 /
- 影像组学 /
- 差异化网络分析 /
- WHO/ISUP核分级 /
- 无进展生存期
Abstract:Objective To predict the World Health Organization/International Society of Urological Pathology (WHO/ISUP) grade of clear cell renal cell carcinoma (ccRCC) using a CT radiomics model based on differential network analysis feature selection and to explore the interpretability of features. Methods A total of 175 ccRCC patients with CT and clinicopathologic data were enrolled in the study, which included a training set of 105 patients and a test set of 70 patients. Segmentation images and feature extraction were performed using ITK-SNAP and PyRadiomics software. The WHO/ISUP grade prediction model was constructed using differential network analysis feature selection with different phases in the training set. The best phase model was then compared with other machine learning models and clinical models. The importance of features in the best phase model was evaluated using K-M survival analysis, Cox regression analysis and risk scores to verify their interpretability. Results The non-contrast phase model was identified as the best phase model, with an AUC of 0.76 in the validation set, performing better than other machine learning models and clinical models (P < 0.05). Kaplan-Meier survival analysis, Cox regression analysis and risk score analyses revealed that the non-contrast phase model could predict progression-free survival well. Conclusion The differential network analysis feature selection was used to select the non- contrast phase model, which could accurately predict the WHO/ISUP grade of ccRCC. The characteristics of this model could predict progression- free survival with strong interpretability. -

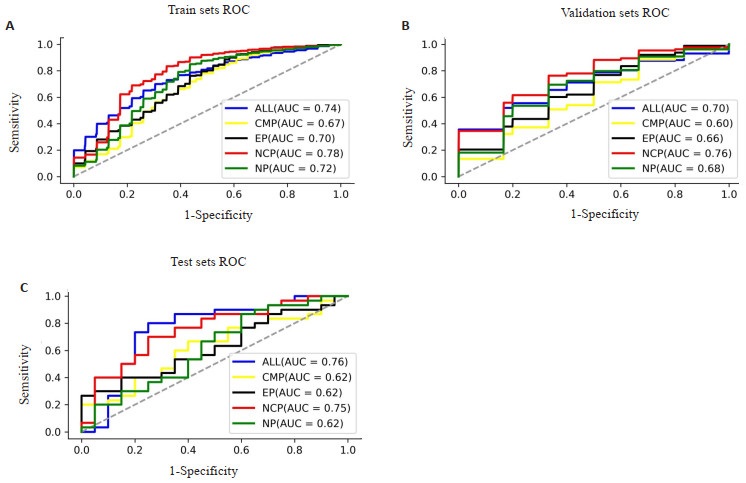
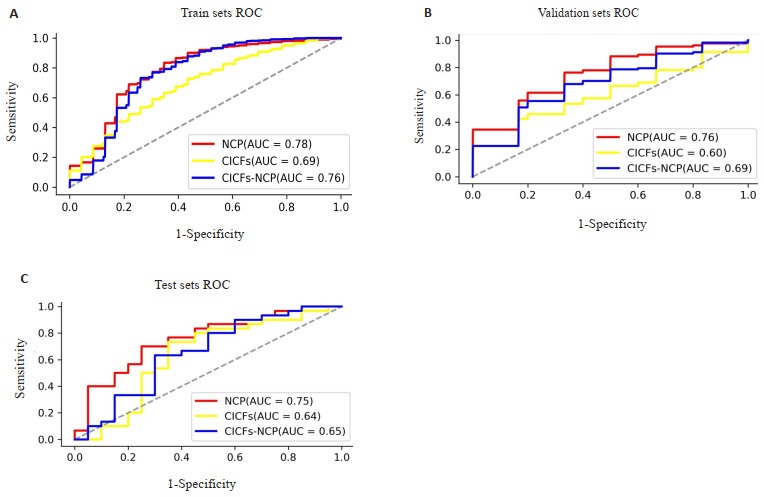
图 3 不同期相模型在训练集(A)、验证集(B)以及测试集(C)上的ROC曲线
Figure 3. The ROC curves of different phase models in the training set (A), validation set (B) and test set (C).

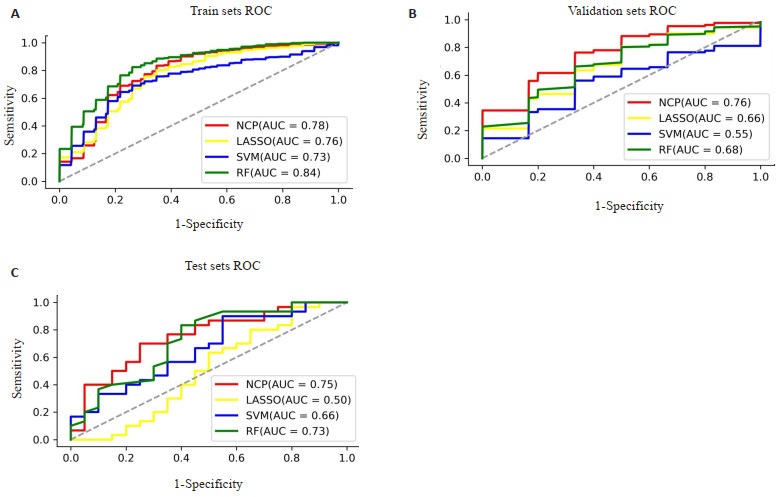
图 4 NCP模型与其他机器学习模型在训练集(A)、验证集(B)以及测试集(C)上的ROC曲线
Figure 4. The ROC curves of NCP model and other machine learning models in the training set (A), validation set (B) and test set (C).

图 5 NCP模型、临床对照模型及联合模型在训练集(A)、验证集(B)以及测试集(C)上的ROC曲线
Figure 5. The ROC curves of NCP model、clinical control model and combined model in the training set (A), validation set (B) and test set (C).

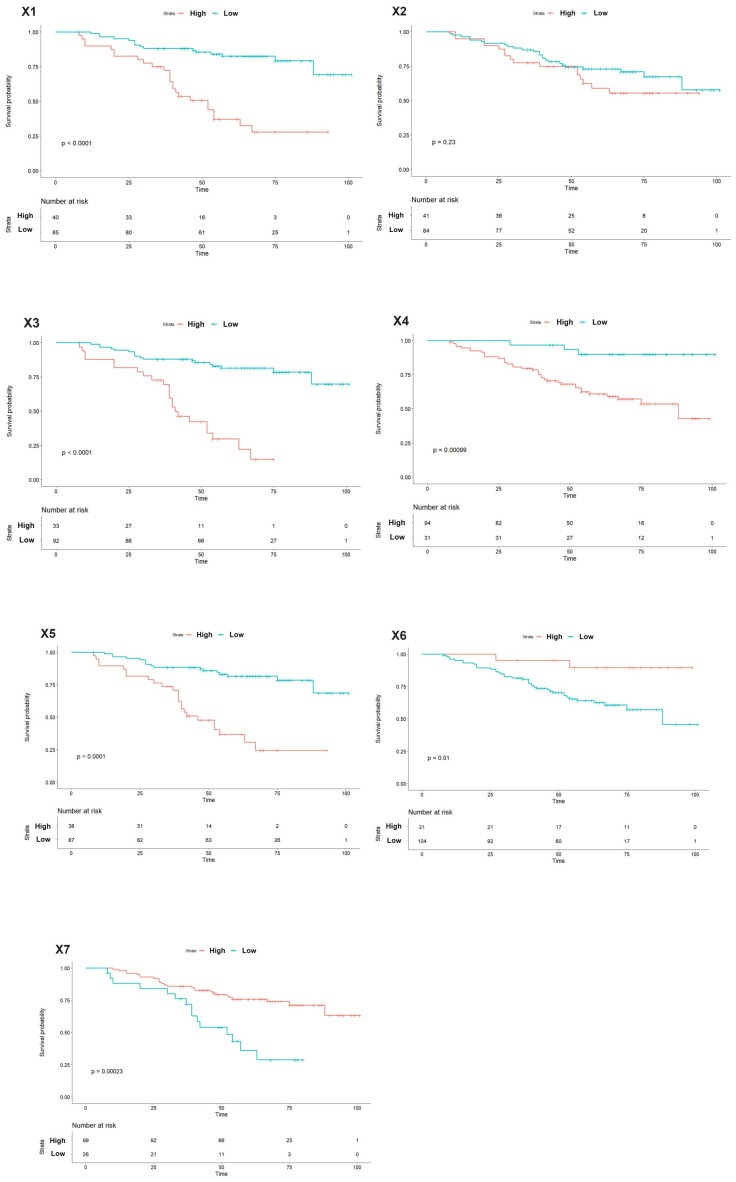
图 6 NCP模型RFs的Kaplan-Meier分析
Figure 6. Kaplan-Meier analysis of the RFs of the NCP model.

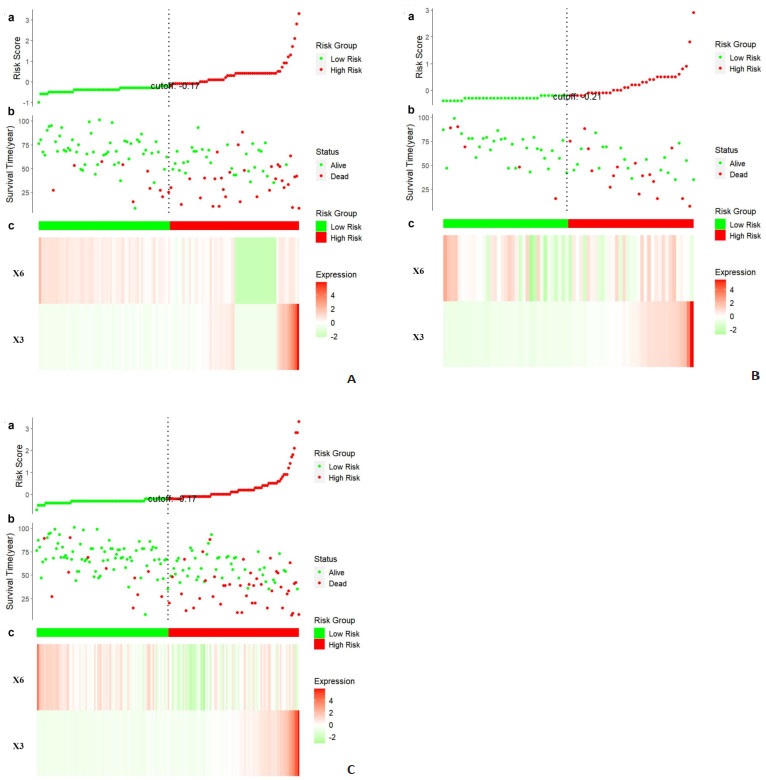
图 7 在训练集、测试集和全数据集上,ccRCC患者基于NCP模型RFs的风险评分分析
Figure 7. Risk score analysis of ccRCC patients in the training set, test set and all data set based on the RFs of the NCP model.
表 1 训练集与测试集患者的临床信息
Table 1. Patient's clinical information between the training set and test set
Characteristic Training set (n=105) Test set (n=70) P Age (years, Mean±SD) 51.1±14.0 54.0±14.1 0.182 Gender[n(%)] 0.255 Male 73 (69.5) 42 (60) Female 32 (30.5) 28 (40) Diameter (mm, median) 50.0 (26.3) 52.0 (22.8) 0.613 WHO/ISUP[n(%)] 0.814 High 72 (68.6) 50 (71.4) Low 33(31.4) 20 (28.6) T stage[n(%)] 0.906 T1 82 (78.1) 53 (75.7) T2 14 (13.3) 11 (15.7) T3 9 (8.6) 6 (8.6) Grow pattern[n(%)] 0.796 Exophytic 34 (32.4) 26 (37.1) Mixed 48 (45.7) 29 (41.4) Endophytic endophytic 23 (21.9) 15 (21.4) WHO/ISUP: World Health Organization/International Society of Urological Pathology.  下载: 导出CSV
表 2 采用差异化网络特征选择的NCP期相模型的RFs
Table 2. The RFs of NCP phase model using the differential network feature selection
Specific name Abbreviation Category Energy X1 Firstorder Uniformity X2 Firstorder Gray level non uniformity X3 GLDM Busyness X4 NGTDM Dependence non uniformity X5 GLDM Gray level non uniformity normalized X6 GLRLM Run level non uniformity normalized X7 GLRLM
下载: 导出CSV
表 3 NCP模型中RFs的单变量和多变量Cox回归分析
Table 3. The univariate and multivariate Cox regression analysis of the RFs of the NCP model
Abbreviation Univariable Multivariable HR (95% CI) P HR (95% CI) P X1 0.17(0.09-0.29) < 0.001 0.46(0.11-1.82) 0.267 X2 0.55(0.28-1.09) 0.087 X3 0.15(0.08-0.27) < 0.001 0.28(0.08-0.90) 0.033 X4 0.24(0.10-0.56) 0.001 0.55(0.21-1.44) 0.222 X5 0.18(0.10-0.31) < 0.001 1.92(0.37-9.85) 0.434 X6 9.61(1.32-69.83) 0.025 8.23(1.09-61.98) 0.041 X7 3.42(1.96-5.96) < 0.001 1.66(0.90-3.04) 0.102
下载: 导出CSV
-
[1] Hirsch MS, Signoretti S, Dal Cin P. Adult renal cell carcinoma: a review of established entities from morphology to molecular genetics[J]. Surg Pathol Clin, 2015, 8(4): 587-621. doi: 10.1016/j.path.2015.09.003 [2] Kuthi L, Jenei A, Hajdu A, et al. Prognostic factors for renal cell carcinoma subtypes diagnosed according to the 2016 WHO renal tumor classification: a study involving 928 patients[J]. Pathol Oncol Res, 2017, 23(3): 689-98. doi: 10.1007/s12253-016-0179-x [3] Cui EM, Li ZY, Ma CY, et al. Predicting the ISUP grade of clear cell renal cell carcinoma with multiparametric MR and multiphase CT radiomics[J]. Eur Radiol, 2020, 30(5): 2912-21. doi: 10.1007/s00330-019-06601-1 [4] Zeng H, Chen LY, Wang MN, et al. Integrative radiogenomics analysis for predicting molecular features and survival in clear cell renal cell carcinoma[J]. Aging, 2021, 13(7): 9960-75. doi: 10.18632/aging.202752 [5] Perrino CM, Cramer HM, Chen SX, et al. World Health Organization (WHO)/International Society of Urological Pathology (ISUP) grading in fine-needle aspiration biopsies of renal masses[J]. Diagn Cytopathol, 2018, 46(11): 895-900. doi: 10.1002/dc.23979 [6] Robila V, Kraft AO, Smith SC. New entities, new technologies, new findings: a review of the cytologic features of recently established subtypes of renal cell carcinoma[J]. Cancer Cytopathol, 2019, 127(2): 79-97. doi: 10.1002/cncy.22093 [7] Siegel RL, Miller KD, Fuchs HE, et al. Cancer statistics, 2022[J]. CA Cancer J Clin, 2022, 72(1): 7-33. doi: 10.3322/caac.21708 [8] Chen WQ, Zheng RS, Baade PD, et al. Cancer statistics in China, 2015[J]. CA A Cancer J Clin, 2016, 66(2): 115-32. doi: 10.3322/caac.21338 [9] Moch H, Cubilla AL, Humphrey PA, et al. The 2016 WHO classification of tumours of the urinary system and male genital organs-part A: renal, penile, and testicular tumours[J]. Eur Urol, 2016, 70(1): 93-105. doi: 10.1016/j.eururo.2016.02.029 [10] Kutikov A, Smaldone MC, Uzzo RG, et al. Renal mass biopsy: always, sometimes, or never?[J]. Eur Urol, 2016, 70(3): 403-6. doi: 10.1016/j.eururo.2016.04.001 [11] Millet I, Curros F, Serre I, et al. Can renal biopsy accurately predict histological subtype and Fuhrman grade of renal cell carcinoma?[J]. J Urol, 2012, 188(5): 1690-4. doi: 10.1016/j.juro.2012.07.038 [12] Gao JH, Ye FD, Han F, et al. A novel radiogenomics biomarker based on hypoxic- gene subset: accurate survival and prognostic prediction of renal clear cell carcinoma[J]. Front Oncol, 2021, 11: 739815. doi: 10.3389/fonc.2021.739815 [13] Huang YQ, Zeng H, Chen LY, et al. Exploration of an integrative prognostic model of radiogenomics features with underlying gene expression patterns in clear cell renal cell carcinoma[J]. Front Oncol, 2021, 11: 640881. doi: 10.3389/fonc.2021.640881 [14] Sanchez A, Feldman AS, Hakimi AA. Current management of small renal masses, including patient selection, renal tumor biopsy, active surveillance, and thermal ablation[J]. J Clin Oncol, 2018, 36 (36): 3591-600. doi: 10.1200/JCO.2018.79.2341 [15] Herrera-Caceres JO, Finelli A, Jewett MAS. Renal tumor biopsy: indicators, technique, safety, accuracy results, and impact on treatment decision management[J]. World J Urol, 2019, 37(3): 437-43. doi: 10.1007/s00345-018-2373-9 [16] Lambin P, Rios- Velazquez E, Leijenaar R, et al. Radiomics: extracting more information from medical images using advanced feature analysis[J]. Eur J Cancer, 2012, 48(4): 441-6. doi: 10.1016/j.ejca.2011.11.036 [17] Pinker K, Shitano F, Sala E, et al. Background, current role, and potential applications of radiogenomics[J]. J Magn Reson Imaging, 2018, 47(3): 604-20. doi: 10.1002/jmri.25870 [18] Grimes T, Potter SS, Datta S. Integrating gene regulatory pathways into differential network analysis of gene expression data[J]. Sci Rep, 2019, 9(1): 5479. doi: 10.1038/s41598-019-41918-3 [19] De Martino A, De Martino D. An introduction to the maximum entropy approach and its application to inference problems in biology[J]. Heliyon, 2018, 4(4): e00596. doi: 10.1016/j.heliyon.2018.e00596 [20] Kocak B, Durmaz ES, Ates E, et al. Unenhanced CT texture analysis of clear cell renal cell carcinomas: a machine learning-based study for predicting histopathologic nuclear grade[J]. AJR Am J Roentgenol, 2019, 212(6): W132-9. doi: 10.2214/AJR.18.20742 [21] Friedman J, Hastie T, Tibshirani R. Sparse inverse covariance estimation with the graphical lasso[J]. Biostatistics, 2008, 9(3): 432-41. doi: 10.1093/biostatistics/kxm045 [22] Motzer RJ, Jonasch E, Agarwal N, et al. Kidney cancer, version 2.2017, NCCN clinical practice guidelines in oncology[J]. J Natl Compr Canc Netw, 2017, 15(6): 804-34. doi: 10.6004/jnccn.2017.0100 [23] Chanda P, Costa E, Hu J, et al. Information theory in computational biology: where we stand today[J]. Entropy (Basel), 2020, 22(6): 627. doi: 10.3390/e22060627 [24] Lai SS, Sun L, Wu JL, et al. Multiphase contrast-enhanced CT-based machine learning models to predict the fuhrman nuclear grade of clear cell renal cell carcinoma[J]. Cancer Manag Res, 2021, 13: 999-1008. doi: 10.2147/CMAR.S290327 [25] Ding JL, Xing ZY, Jiang ZX, et al. CT-based radiomic model predicts high grade of clear cell renal cell carcinoma[J]. Eur J Radiol, 2018, 103: 51-6. doi: 10.1016/j.ejrad.2018.04.013 [26] Lin F, Cui EM, Lei Y, et al. CT-based machine learning model to predict the Fuhrman nuclear grade of clear cell renal cell carcinoma[J]. Abdom Radiol, 2019, 44(7): 2528-34. doi: 10.1007/s00261-019-01992-7 [27] Bektas CT, Kocak B, Yardimci AH, et al. Clear cell renal cell carcinoma: machine learning-based quantitative computed tomography texture analysis for prediction of fuhrman nuclear grade[J]. Eur Radiol, 2019, 29(3): 1153-63. doi: 10.1007/s00330-018-5698-2 [28] Feng Z, Shen QJ, Li Y, et al. CT texture analysis: a potential tool for predicting the Fuhrman grade of clear-cell renal carcinoma[J]. Cancer Imaging, 2019, 19(1): 6. doi: 10.1186/s40644-019-0195-7 [29] Goh V, Ganeshan B, Nathan P, et al. Assessment of response to tyrosine kinase inhibitors in metastatic renal cell cancer: CT texture as a predictive biomarker[J]. Radiology, 2011, 261(1): 165-71. doi: 10.1148/radiol.11110264 [30] Lubner MG, Stabo N, Abel EJ, et al. CT textural analysis of large primary renal cell carcinomas: pretreatment tumor heterogeneity correlates with histologic findings and clinical outcomes[J]. AJR Am J Roentgenol, 2016, 207(1): 96-105. doi: 10.2214/AJR.15.15451 -

 点击查看大图
计量
- 文章访问数: 125
- HTML全文浏览量: 64
- PDF下载量: 5
- 被引次数: 0