


全瘤及瘤周感兴趣体积双区域T1 mapping定量参数结合钆塞酸二钠增强MRI对肝细胞癌微血管侵犯的评估价值
doi: 10.12122/j.issn.1674-4500.2023.03.05
Value of quantitative parameters of T1 mapping obtained from volume of interest of tumor and peritumoral combined with gadoxetic acid-enhanced MRI in evaluating microvascular invasion of hepatocellular carcinoma
-
摘要:
目的 探讨全瘤及瘤周感兴趣体积(VOI)双区域T1 mapping定量参数结合钆塞酸二钠增强MRI对肝细胞癌微血管侵犯(MVI)的评估价值。 方法 对我院2019年1月~2022年9月术后病理诊断为单发性肝细胞癌的72例患者进行回顾性分析,并根据MVI表达状态分为MVI阳性组(n=23)、MVI阴性组(n=49)。术前行钆塞酸二钠增强MRI T1 mapping扫描,得到平扫(Pre)、肝胆期(HBP)两期的T1 mapping图像。利用3D Slicer软件逐层勾画出全瘤(tumor)、瘤周(peritumor)、全瘤+瘤周的VOI并得到VOItumor、VOIperitumor 1 cm、VOIperitumor 2 cm、VOItumor+1 cm、VOItumor+2 cm,测量出各个VOI的定量参数—T1弛豫时间(T1rt)和T1弛豫时间减低率(rrT1rt),比较MVI阳性组及阴性组间定量参数的差异,采用ROC曲线和净重分类指数(NRI)分析各定量参数的诊断效能。 结果 两组间T1rt-Pre-VOItumor、T1rt-Pre-VOI peritumor 1 cm、T1rt-Pre-VOItumor+1 cm、T1rt-Pre-VOItumor+2 cm、T1rt-HBP-VOItumor、T1rt-HBP-VOItumor+ 1 cm、T1rt-HBP-VOItumor+ 2 cm、rrT1rt-VOItumor+ 2 cm差异均有统计学意义(P < 0.05),其AUC值为0.720、0.689、0.748、0.730、0.727、0.726、0.717、0.639。多期参数T1rt-Pre-HBP-VOItumor、T1rt-Pre-HBP-VOItumor+1 cm、T1rt-Pre-HBP-VOItumor+2 cm的AUC值为0.740、0.756、0.743,其中T1rt-Pre-HBP-VOItumor+1 cm的诊断效能最高。NRI分析得出T1rt-Pre-VOItumor+1 cm、T1rt-HBP-VOItumor+1 cm与T1rt-Pre-VOItumor+2 cm、T1rt-HBP-VOItumor+2 cm比较均具有正向改善,NRI值为0.6158、0.4011。T1rt-Pre-HBP-VOItumor+1 cm分别与T1rt-Pre-VOItumor+1 cm、T1rt-HBP-VOItumor+1 cm比较均具有正向改善,NRI值分别为0.0692、0.5643。 结论 平扫、肝胆期的全瘤T1弛豫时间具有较好的诊断效能,且结合瘤周1 cm的T1弛豫时间诊断效能高于结合瘤周2 cm。多期T1弛豫时间的诊断效能高于单期,T1rt-Pre-HBP-VOItumor+1 cm诊断效能最高。 Abstract:Objective To investigate the value of dual-region T1 mapping quantitative parameters of whole tumor and peritumoral volume of interest (VOI) combined with GD-EOB-DTPA enhanced MRI in evaluating microvascular invasion (MVI) of hepatocellular carcinoma. Methods From January 2019 to September 2022, 72 patients with single hepatocellular carcinoma diagnosed by postoperative pathology in our hospital were retrospectively analyzed. According to the expression status of MVI, it was divided into MVI positive group (n=23) and MVI negative group (n=49). GD-EOB-DTPA enhanced MRI T1 mapping scan was performed before operation, and T1 mapping images of pre-enhancement phase (Pre) and hepatobiliary phase (HBP) were obtained. The VOI of tumor, peritumoral and tumor plus peritumor were drawn layer by layer by using 3D Slicer software and VOItumor, VOIperitumor 1 cm, VOIperitumor 2 cm, VOItumor + 1 cm, VOItumor + 2 cm were obtained. The quantitative parameters of each VOI, T1 relaxation time (T1rt) and T1 relaxation time reduction rate (rrT1rt) were measured. We compared the differences of quantitative parameters between the two groups. ROC curve and net reclassification index (NRI) were used to analyze the diagnostic efficacy of each quantitative parameter. Results T1rt-Pre-VOItumor, T1rt-Pre-VOIperitumor 1 cm, T1rt-Pre- VOItumor + 1 cm, T1rt-Pre-VOItumor+2 cm, T1rt-HBP-VOItumor, T1rt-HBP-VOItumor+1 cm, T1rt-HBP-VOItumor+2 cm, rrT1rt-VOItumor+2 cm between the two groups were statistically significant (P < 0.05). The AUC were 0.720, 0.689, 0.748, 0.730, 0.727, 0.726, 0.717, 0.639. The AUC of multiphase quantitative parameter, T1rt-Pre-HBP-VOItumor, T1rt- Pre- HBP- VOItumor + 1 cm, T1rt-Pre-HBP-VOItumor + 2 cm, were 0.740, 0.756, 0.743, among which T1rt-Pre-HBP-VOItumor+ 1 cm had the highest diagnostic efficiency. NRI analysis showed that T1rt-Pre- VOItumor + 1 cm, T1rt- HBP- VOItumor + 1 cm had positive improvement compared with T1rt-Pre-VOItumor + 2 cm, T1rt-HBP-VOItumor + 2 cm. NRI values were 0.6158 and 0.4011. T1rt-Pre-HBP-VOItumor + 1 cm showed positive improvement compared with T1rt-Pre-VOItumo1 cm and T1rt-HBP-VOItumor + 1 cm, and the NRI values were 0.0692 and 0.5643, respectively. Conclusion The T1 relaxation time of tumor in Pre and HBP has good diagnostic efficacy for microvascular invasion in hepatocellular carcinoma. Combined with peritumoral 1 cm has higher diagnostic efficacy than peritumoral 2 cm. The diagnostic efficacy of multiphase quantitative parameter is higher than single-phase quantitative parameter and T1rt-Pre-HBP-VOItumor+1 cm is the highest. -

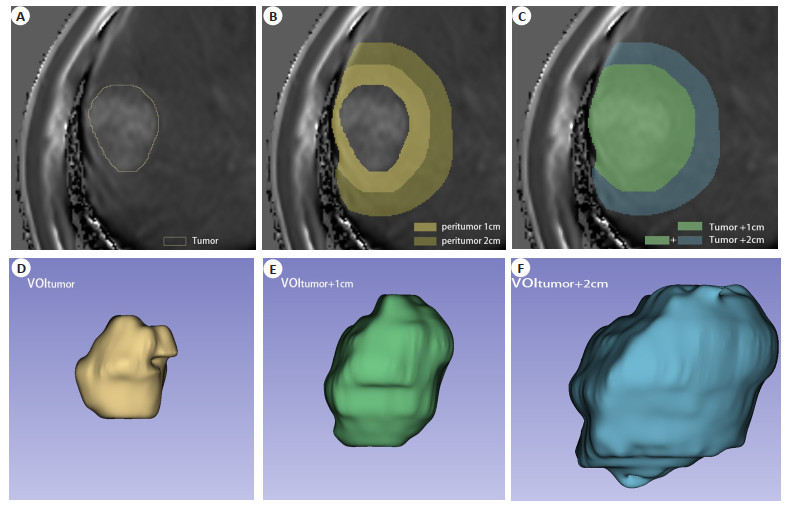
图 1 VOI的绘制以及T1弛豫时间的测量
Figure 1. The drawing of VOI and the measurement of T1 relaxation time. A: VOI of HBP tumor, T1rt- HBP- VOItumor=685.20 ms; B: VOI of HBP peritumor, T1rt-HBP-VOIperitumor 1cm=507.44 ms, T1rt-HBP-VOIperitumor 2cm=483.70 ms; C: VOI of HBP tumor and peritumor, T1rt-HBP-VOItumor+1cm=570.61 ms, T1rt-HBP-VOItumor+2cm=521.41 ms; D-F: Display 3D views of VOItumor, VOItumor+1cm, and VOItumor+2cm, re-spectively.

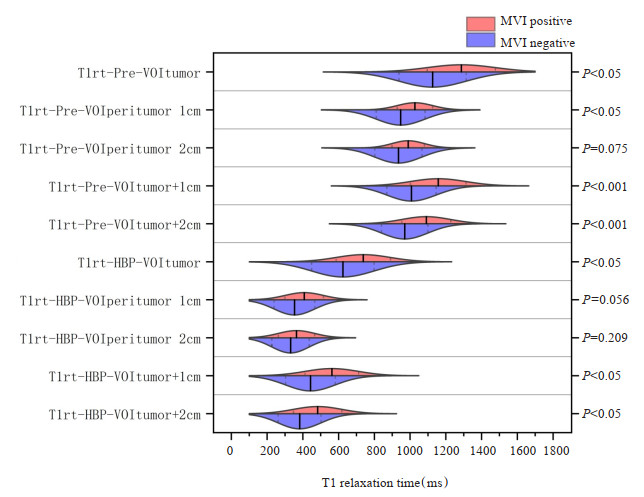
图 2 MVI阳性组与MVI阴性组HCC之间T1弛豫时间的比较
Figure 2. Comparisons of T1 relaxation time between MVI- positive and MVI-negative HCCs.

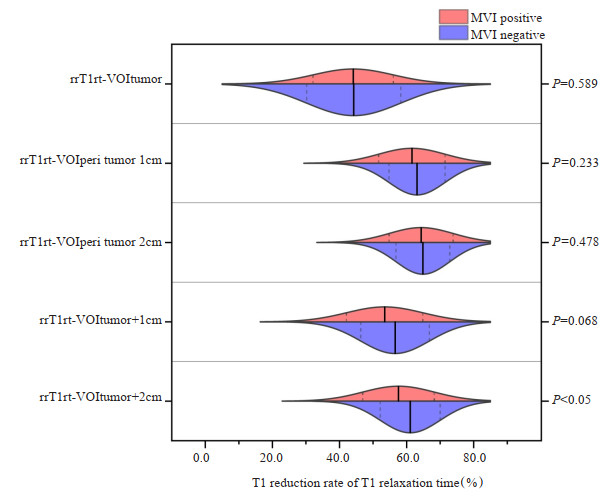
图 3 MVI阳性组与MVI阴性组HCC之间T1弛豫时间减低率的比较
Figure 3. Comparisons of reduction rate of T1 relaxation time between MVI-positive and MVI-negative HCCs.

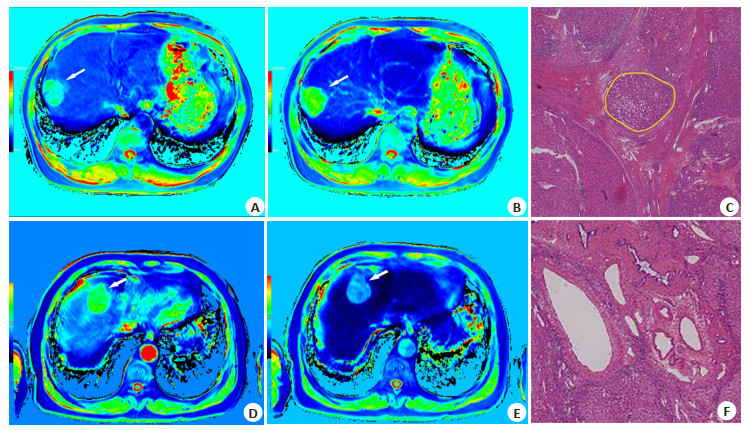
图 4 MVI阴性组及阳性组具有代表性的T1 mapping图像
Figure 4. Representative T1 mapping images of MVI negative group and positive group. A-C: Male, 50-year-old, hepatocellular carcinoma grade 3, MVI positive. A: The tumor can be seen in T1 mapping pseudo- color image during Pre(white arrow), T1rt-Pre-VOItumor=1211.39 ms; B: The tumor can be seen in T1 mapping pseudo-color image during HBP (white arrow), T1rt- HBP-VOItumor=685.20 ms; C: Pathology showed tumor emboli in the microvessels around the tumor (in the yellow circle, HE, ×20); D- F: Male, 36- year- old, hepatocellular carcinoma grade 3, MVI negative. D: The tumor can be seen in T1 mapping pseudo- color image during Pre (white arrow), T1rt- Pre- VOItumor=1473.92 ms; E: The tumor can be seen in T1 mapping pseudo-color image during HBP(white arrow), T1rt-HBP-VOItumor=740.32 ms; F: Pathology showed that there were no tumor emboli in the microvessels around the tumor (HE staining, ×20).
表 1 两组间定量参数比较
Table 1. Comparative analysis of quantitative parameters between two groups
Quantitative parameters Sequence VOI MVI-(n=49) MVI+(n=23) t P Tumor 1125.98±188.28 1286.49±190.88 -3.358 < 0.05 Peritumor 1cm 947.15±136.58 1027.07±99.24 -2.508 < 0.05
PrePeritumor 2cm 934.34±131.72 989.24±90.64 -1.805 0.075 Tumor+1cm 1007.58±137.93 1157.16±155.87 -4.115 < 0.001 Tumor+2cm 969.74±129.74 1090.57±136.95 -3.620 < 0.001 T1rt Tumor 623.66±174.52 738.12±151.99 -2.699 < 0.05 Peritumor 1cm 352.84±113.69 407.73±107.99 -1.940 0.056
HBPPeritumor 2cm 331.12±104.73 364.41±101.66 -1.269 0.209 Tumor+1cm 442.26±139.13 561.88±149.81 -3.320 < 0.05 Tumor+2cm 381.6±119.82 482.87±135.65 -3.205 < 0.05 Tumor 44.23%±14.01% 42.46%±10.05% 0.543 0.589 Peritumor 1cm 63.10%±8.37% 60.52%±8.76% 1.203 0.233 rrT1rt - Peritumor 2cm 64.85%±8.01% 63.37%±8.66% 0.714 0.478 Tumor+1cm 56.56%±10.24% 51.83%±9.74% 1.857 0.068 Tumor+2cm 61.07%±8.92% 56.16%±9.27% 2.151 0.035 T1rt: T1 relaxation time; rrT1rt: Reduction rate of T1 relaxation time; Pre: Pre-enhancement phase; HBP: Hepatobiliary phase;
VOI: Volume of interest. 下载: 导出CSV
表 2 两组间定量参数诊断效能分析
Table 2. Analysis of diagnostic efficacy of quantitative parameters between two groups
VOI Sensitivity(%) Specificity(%) AUC(95% CI) Youden index P Cut-off Pre-VOItumor 60.87 77.55 0.720(0.602-0.820) 0.38 < 0.001 1251.54 Pre-VOIperitumor 1cm 86.96 51.02 0.689(0.569-0.793) 0.38 < 0.05 937.62 Pre-VOItumor+1cm 78.26 61.22 0.748(0.632-0.843) 0.39 < 0.001 1044.27 Pre-VOItumor+2cm 60.87 81.63 0.730(0.613-0.828) 0.43 < 0.001 1044.24 HBP-VOItumor 65.22 79.59 0.727(0.609-0.825) 0.45 < 0.001 740.33 HBP-VOItumor+1cm 56.52 83.67 0.726(0.608-0.824) 0.40 < 0.001 560.41 HBP-VOItumor+2cm 52.17 85.71 0.717(0.598-0.817) 0.38 < 0.001 475.65 rrT1rt-VOItumor+2cm 43.48 87.76 0.639(0.517-0.749) 0.31 0.059 0.52 Pre-HBP-VOItumor 82.61 65.31 0.740(0.623-0.836)a 0.48 < 0.001 - Pre-HBP-VOItumor+1cm 65.22 77.55 0.756(0.640-0.850)a 0.43 < 0.001 - Pre-HBP-VOItumor+2cm 60.87 81.63 0.743(0.626-0.839)a 0.43 < 0.001 - aAUC value was obtained by regression equation.
下载: 导出CSV
表 3 VOI间定量参数诊断效能比较分析
Table 3. Comparative analysis of diagnostic efficiency of quantitative parameters between VOI
Quantitative parameters Diverse combinations NRI(%) PNRI PAUC Pre-Tumor+1cm vs Pre-Tumor 52.88 0.029 0.653 HBP-Tumor+1cm vs HBP-Tumor 70.28 0.002 0.983 Pre-Tumor+2cm vs Pre-Tumor 32.48 0.184 0.873 HBP-Tumor+2cm vs HBP-Tumor 36.56 0.135 0.846 Pre-Tumor+1cm vs Pre-Tumor+2cm 61.58 0.009 0.492 HBP-Tumor+1cm vs HBP-Tumor+2cm 40.11 0.105 0.652 T1rt Pre-Tumor vs HBP-Tumor 36.56 0.134 0.922 Pre-Tumor+1cm vs HBP-Tumor+1cm 48.27 0.049 0.632 Pre-Tumor+2cm vs HBP-Tumor+2cm 31.94 0.198 0.733 Pre-HBP-Tumor vs Pre-Tumor 48.80 0.045 0.385 Pre-HBP-Tumor vs HBP-Tumor 44.19 0.073 0.767 Pre-HBP-Tumor+1cm vs Pre-Tumor+1cm 6.92 0.783 0.492 Pre-HBP-Tumor+1cm vs HBP-Tumor+1cm 56.43 0.021 0.444 NRI: Net reclassification improvement
下载: 导出CSV
-
[1] Siegel RL, Miller KD, Fuchs HE, et al. Cancer statistics, 2021[J]. CA A Cancer J Clin, 2021, 71(1): 7-33. doi: 10.3322/caac.21654 [2] Chen WQ, Zheng RS, Baade PD, et al. Cancer statistics in China, 2015[J]. CA A Cancer J Clin, 2016, 66(2): 115-32. doi: 10.3322/caac.21338 [3] Xie DY, Ren ZG, Zhou J, et al. 2019 Chinese clinical guidelines for the management of hepatocellular carcinoma: updates and insights [J]. Hepatobiliary Surg Nutr, 2020, 9(4): 452-63. doi: 10.21037/hbsn-20-480 [4] Hao K, Luk JM, Lee NPY, et al. Predicting prognosis in hepatocel-lular carcinoma after curative surgery with common clinicopatho-logic parameters[J]. BMC Cancer, 2009, 9: 389. doi: 10.1186/1471-2407-9-389 [5] Wayne JD, Lauwers GY, Ikai I, et al. Preoperative predictors of survival after resection of small hepatocellular carcinomas[J]. Ann Surg, 2002, 235(5): 722-30. doi: 10.1097/00000658-200205000-00015 [6] Vauthey JN, Klimstra D, Franceschi D, et al. Factors affecting long-term outcome after hepatic resection for hepatocellular carcinoma [J]. Am J Surg, 1995, 169(1): 28-34;discussion 34-35. doi: 10.1016/S0002-9610(99)80106-8 [7] Lim KC, Chow PKH, Allen JC, et al. Microvascular invasion is a better predictor of tumor recurrence and overall survival following surgical resection for hepatocellular carcinoma compared to the Milan criteria[J]. Ann Surg, 2011, 254(1): 108-13. doi: 10.1097/SLA.0b013e31821ad884 [8] Miyata R, Tanimoto A, Wakabayashi G, et al. Accuracy of preoperative prediction of microinvasion of portal vein in hepatocellular carcinoma using superparamagnetic iron oxide-enhanced magnetic resonance imaging and computed tomography during hepatic angiography[J]. J Gastroenterol, 2006, 41(10): 987-95. doi: 10.1007/s00535-006-1890-2 [9] Kim KA, Kim MJ, Jeon HM, et al. Prediction of microvascular invasion of hepatocellular carcinoma: usefulness of peritumoral hypointensity seen on gadoxetate disodium-enhanced hepatobiliary phase images[J]. J Magn Reson Imaging, 2012, 35(3): 629-34. doi: 10.1002/jmri.22876 [10] Eguchi S, Takatsuki M, Hidaka M, et al. Predictor for histological microvascular invasion of hepatocellular carcinoma: a lesson from 229 consecutive cases of curative liver resection[J]. World J Surg, 2010, 34(5): 1034-8. doi: 10.1007/s00268-010-0424-5 [11] Shirabe K, Kajiyama K, Harimoto N, et al. Prognosis of hepatocellular carcinoma accompanied by microscopic portal vein invasion[J]. World J Gastroenterol, 2009, 15(21): 2632-7. doi: 10.3748/wjg.15.2632 [12] 陈茂东, 张静, 杨桂香, 等. 基于普美显增强磁共振的影像组学鉴别肝细胞癌与肝血管瘤[J]. 南方医科大学学报, 2018, 38(4): 428-33. https://www.cnki.com.cn/Article/CJFDTOTAL-DYJD201804011.htm [13] Haimerl M, Verloh N, Zeman F, et al. Gd-EOB-DTPA-enhanced MRI for evaluation of liver function: comparison between signal-intensity-based indices and T1 relaxometry[J]. Sci Rep, 2017, 7: 43347. doi: 10.1038/srep43347 [14] 张涛, 陆健, 张学琴, 等. 钆塞酸二钠增强T1-mapping成像和DWI对肝纤维化分期的评估价值[J]. 放射学实践, 2020, 35(2): 203-7. https://www.cnki.com.cn/Article/CJFDTOTAL-FSXS202002019.htm [15] 汪苍, 刘晓蕾, 米瑞, 等. 磁共振T1 mapping、T2 mapping和BOLD对大鼠肝纤维化分期定量诊断价值的比较[J]. 临床放射学杂志, 2018, 37(2): 341-5. https://www.cnki.com.cn/Article/CJFDTOTAL-LCFS201901045.htm [16] 成戈, 董妍, 余雪燕, 等. Gd-EOB-DTPA增强MRI T1 mapping鉴别不同分化程度肝细胞癌的价值[J]. 临床放射学杂志, 2021, 40(4): 717-22. https://www.cnki.com.cn/Article/CJFDTOTAL-LCFS202104021.htm [17] 刘子蔚, 杨少民, 陈海雄, 等. 钆塞酸二钠增强MRI T1 mapping定量参数与肝细胞癌Ki-67表达的相关性研究[J]. 磁共振成像, 2022, 13(9): 35-40, 52. https://www.cnki.com.cn/Article/CJFDTOTAL-CGZC202209007.htm [18] 徐萍, 黄梦琪, 廖冰, 等. Gd-EOB-DTPA MRI动态增强预测孤立性肝细胞癌微血管侵犯的单因素及多因素回归分析[J]. 影像诊断与介入放射学, 2017, 26(1): 31-6. https://www.cnki.com.cn/Article/CJFDTOTAL-YXZD201701006.htm [19] Craig AJ, von Felden J, Garcia-Lezana T, et al. Tumour evolution in hepatocellular carcinoma[J]. Nat Rev Gastroenterol Hepatol, 2020, 17(3): 139-52. doi: 10.1038/s41575-019-0229-4 [20] Xu X, Zhang HL, Liu QP, et al. Radiomic analysis of contrast-enhanced CT predicts microvascular invasion and outcome in hepatocellular carcinoma[J]. J Hepatol, 2019, 70(6): 1133-44. doi: 10.1016/j.jhep.2019.02.023 [21] Chong HH, Yang L, Sheng RF, et al. Multi-scale and multi-parametric radiomics of gadoxetate disodium-enhanced MRI predicts microvascular invasion and outcome in patients with solitary hepatocellular carcinoma≤5 cm[J]. Eur Radiol, 2021, 31(7): 4824-38. doi: 10.1007/s00330-020-07601-2 [22] Nebbia G, Zhang Q, Arefan D, et al. Pre- operative microvascular invasion prediction using multi-parametric liver MRI radiomics[J]. J Digit Imaging, 2020, 33(6): 1376-86. doi: 10.1007/s10278-020-00353-x [23] Zhang R, Xu L, Wen X, et al. A nomogram based on bi- regional radiomics features from multimodal magnetic resonance imaging for preoperative prediction of microvascular invasion in hepatocellular carcinoma[J]. Quant Imaging Med Surg, 2019, 9(9): 1503-15. [24] Chong HH, Gong YD, Pan XP, et al. Peritumoral dilation radiomics of gadoxetate disodium-enhanced MRI excellently predicts early recurrence of hepatocellular carcinoma without macrovascular invasion after hepatectomy[J]. J Hepatocell Carcinoma, 2021, 8: 545-63. [25] Hu F, Zhang YH, Li M, et al. Preoperative prediction of microvascular invasion risk grades in hepatocellular carcinoma based on tumor and peritumor dual-region radiomics signatures[J]. Front Oncol, 2022, 12: 853336. [26] Wang W T, Zhu S, Ding Y, et al. T1 mapping on gadoxetic acid-enhanced MR imaging predicts recurrence of hepatocellular carcinoma after hepatectomy[J]. Eur J Radiol, 2018, 103: 25-31. [27] Ding Y, Rao SX, Chen CZ, et al. Assessing liver function in patients with HBV-related HCC: a comparison of T1 mapping on Gd-EOB-DTPA-enhanced MR imaging with DWI[J]. Eur Radiol, 2015, 25(5): 1392-8. [28] Rodríguez-Perálvarez M, Luong TV, Andreana L, et al. A systemat-ic review of microvascular invasion in hepatocellular carcinoma: diagnostic and prognostic variability[J]. Ann Surg Oncol, 2013, 20(1): 325-39. [29] Lambregts DMJ, Beets GL, Maas M, et al. Tumour ADC measurements in rectal cancer: effect of ROI methods on ADC values and interobserver variability[J]. Eur Radiol, 2011, 21(12): 2567-74. [30] Roth Y, Tichler T, Kostenich G, et al. High- b- value diffusion-weighted MR imaging for pretreatment prediction and early monitoring of tumor response to therapy in mice[J]. Radiology, 2004, 232(3): 685-92. [31] Chen YD, Xia YW, Tolat PP, et al. Comparison of conventional gadoxetate disodium- enhanced MRI features and radiomics signatures with machine learning for diagnosing microvascular invasion[J]. AJR Am J Roentgenol, 2021, 216(6): 1510-20. [32] Rao CY, Wang XQ, Li MD, et al. Value of T1 mapping on gadoxetic acid- enhanced MRI for microvascular invasion of hepatocellular carcinoma: a retrospective study[J]. BMC Med Imaging, 2020, 20(1): 43. [33] Zhang SS, Huo L, Zhang J, et al. A preoperative model based on gadobenate- enhanced MRI for predicting microvascular invasion in hepatocellular carcinomas (≤ 5 cm)[J]. Front Oncol, 2022, 12: 992301. [34] Yang L, Gu DS, Wei JW, et al. A radiomics nomogram for preoperative prediction of microvascular invasion in hepatocellular carcinoma[J]. Liver Cancer, 2019, 8(5): 373-86. [35] Wang Q, Li CF, Zhang JX, et al. Radiomics models for predicting microvascular invasion in hepatocellular carcinoma: a systematic review and radiomics quality score assessment[J]. Cancers, 2021, 13(22): 5864. [36] Song DJ, Wang YY, Wang WT, et al. Using deep learning to predict microvascular invasion in hepatocellular carcinoma based on dynamic contrast-enhanced MRI combined with clinical parameters [J]. J Cancer Res Clin Oncol, 2021, 147(12): 3757-67. [37] Okada M, Murakami T, Kuwatsuru R, et al. Biochemical and clinical predictive approach and time point analysis of hepatobiliary phase liver enhancement on Gd-EOB-DTPA-enhanced MR images: a multicenter study[J]. Radiology, 2016, 281(2): 474-83. -

 点击查看大图
计量
- 文章访问数: 77
- HTML全文浏览量: 82
- PDF下载量: 5
- 被引次数: 0