

MRI analysis of gastrointestinal stromal tumors and prospective study of apparent dispersion coefficient images in the differential diagnosis of benign and malignant tumors
-
摘要:
目的 研究胃肠道间质瘤的MRI影像学分析及其表观弥散系数(ADC)图像对肿瘤良恶性的鉴别诊断。 方法 本研究为前瞻性研究,以2019年10月~2021年10月在本院治疗的胃肠道间质瘤患者120例作为研究对象,按疾病严重程度分为极低危险度11例,低危险度22例,中危险度41例,高危险度46例。根据病理结果分为良性肿瘤患者35例,恶性肿瘤患者85例。所有患者入组后均进行MRI检查,比较良性组、恶性组、不同危险度的患者的影像学特征以及ADC数值之间的差异。 结果 良性组以及恶性组患者的ADC、变异度、偏度、最大值、最小值、全距、中位数、10%数值、90%数值以及均匀度之间的差异有统计学意义(P < 0.05);极低危险度、低危险度、中危险度以及高危险度组患者的ADC、变异度、偏度、最大值、最小值、全距、中位数、10%数值、90%数值以及均匀度之间的差异有统计学意义(P < 0.05);良性组以及恶性组的最大直径、肿瘤形态、边界之间的差异有统计学意义(P < 0.05);不同危险度的患者的最大直径、肿瘤形态、边界之间的差异有统计学意义(P < 0.05)。 结论 不同严重程度以及良恶性胃肠道间质瘤的MRI影像学中的最大直径、肿瘤形态、边界存在显著的差异,其ADC图像对肿瘤良恶性具有显著的鉴别诊断意义。 Abstract:Objective To explore the MRI imaging analysis of gastrointestinal stromal tumors and the differential diagnosis of benign and malignant tumors by apparent dispersion coefficient (ADC) images. Methods This study was a prospective study, 120 patients with gastrointestinal stromal tumor who were treated in our hospital from October 2019 to October 2021 were selected. Disease severity: 11 patients with very low risk, 22 patients with low risk, 41 patients with medium risk and 46 patients with high risk. According to the analysis of pathological results, 35 patients with benign tumor and 85 patients with malignant tumor were enrolled. MRI examination was performed on all patients after enrollment, and the differences of imaging characteristics and ADC values between benign group, malignant group and patients with different risk were compared. Results The differences of ADC, variation, skewness, maximum, minimum, total distance, median, 10% value, 90% value and evenness between benign group and malignant group were statistically significant (P < 0.05). There were statistically significant differences among ADC, variance, skewness, maximum, minimum, total distance, median, 10% value, 90% value and evenness of patients with very low risk, low risk, medium risk and high risk group (P < 0.05). The differences of maximum diameter, tumor morphology and boundary between benign group and malignant group were significant(P < 0.05). The differences in maximum diameter, tumor morphology and boundary among patients with different risk levels were statistically significant (P < 0.05). Conclusion There are significant differences in the maximum diameter, tumor morphology and boundary in MRI imaging of benign and malignant gastrointestinal stromal tumors with different severity, and their ADC images have significant differential diagnosis significance for benign and malignant tumors. -

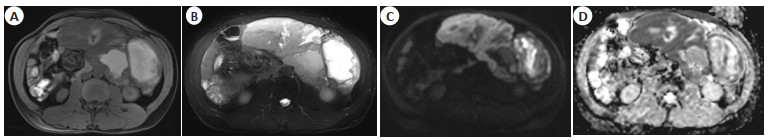
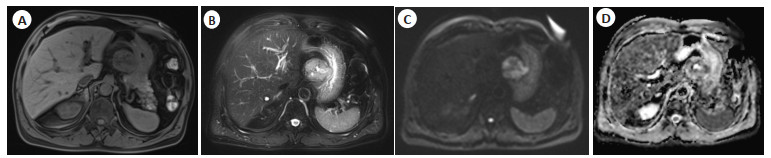
图 1 患者1的胃肠道间质瘤MRI影像图
患者男, 66岁, 低危险度胃肠道间质瘤, A: T1WI(脂肪抑制)呈等信号; B: T2WI(脂肪抑制)呈稍高信号, 信号不均, 中央见液化坏死区; C: DWI图像呈明显高信号;D: ADC图像呈等低混杂信号影.
Figure 1. MRI imaging of gastrointestinal stromal tumors of patient 1.

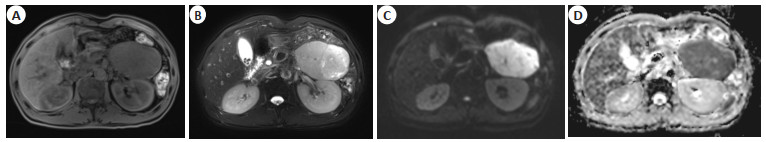
图 2 患者2的胃肠道间质瘤的MRI影像图
患者男, 39岁, 高危险度胃肠道间质瘤, A: T1WI(脂肪抑制)信号不均, 主要呈等信号, 部分呈高信号; B: T2WI(脂肪抑制)呈稍高信号, 部分见高信号液化坏死区; C: DWI图像呈高信号; D: ADC图像以等低混杂信号为主.
Figure 2. MRI imaging of gastrointestinal stromal tumors of patient 2.

图 3 患者3的胃肠道间质瘤的MRI影像图
患者男, 41岁, 高危险度胃肠道间质瘤, A: T1WI(脂肪抑制)呈高、低混杂信号; B: T2WI(脂肪抑制)呈稍高、高、低混杂信号; C: DWI图像呈高信号; D: ADC图像呈等低混杂信号影.
Figure 3. MRI imaging of gastrointestinal stromal tumors of patient 3.
表 1 两组患者的一般资料比较
Table 1. Comparison of general data between the two groups (Mean±SD)
组別 性別(男/女,n) BMI(kg/m2) 年龄(岁) 良性组(n=35) 17/18 24.54±2.69 69.61±2.63 恶件组(n=85) 52/33 24.51±1.51 69.65±1.96 χ2/t 0.047 0.065 0.081 P 0.829 0.949 0.936  下载: 导出CSV
表 2 良性组以及恶性组患者的ADC数值分析
Table 2. ADC numerical analysis of patients in benign group and malignant group (Mean±SD)
指标 良性组(n=35) 恶性组(n=85) t P ADC(10-6mm2/s) 1696.91±551.97 1115.71±552.48 5.241 < 0.001 变异度 142 018.78±89 522.01 220 677.02±4685.86 5.195 < 0.001 偏度 0.33±0.19 0.77±0.12 12.697 < 0.001 最大值(10-6mm2/s) 3315.53±252.08 3815.48±2.74 11.733 < 0.001 最小值(10-6mm2/s) 279.52±52.08 1.53±1.96 31.569 < 0.001 全距(10-6mm2/s) 2316.85±91.86 3319.41±92.97 54.15 < 0.001 中位数(10-6mm2/s) 1518.25±52.57 125.26±32.41 145.771 < 0.001 10% 数值(10-6mm2/s) 1228.47±15.94 718.39±62.43 69.991 < 0.001 90% 数值(10-6mm2/s) 2079.43±661.73 1762.89±711.98 2.329 0.022 峰度 3.88±1.43 3.82±1.76 0.195 0.846 均匀度 0.03±0.01 0.01±0.01 9.958 < 0.001 ADC: 表观弥散系数.
下载: 导出CSV
表 3 不同危险度的患者的ADC数值分析
Table 3. ADC numerical analysis of patients with different risk levels (Mean±SD)
指标 极低危险组(n=11) 低危险组(n=22) 中危险组(n=41) 高危险组(n=46) F P ADC(10-6mm2/s) 1758.63±521.94 1697.56±522.72 1215.13±251.61 1104.95±252.51 17.124 < 0.001 变异度 136615.27±5222.07 145245.68±5611.72 200019.73±5911.78 226357.51±5672.38 4.891 < 0.001 偏度 0.29±0.06 0.32±0.08 0.58±0.22 0.79±0.18 18.012 < 0.001 最大值(10-6mm2/s) 3114.8±252.37 3525.7±251.73 3899.8±251.69 4018.09±222.05 15.744 < 0.001 最小值(10-6mm2/s) 288.88±51.85 155.57±51.77 19.44±2.91 1.21±0.18 12.015 < 0.001 全距(10-6mm2/s) 2310.81±52.92 2366.36±62.92 3019.59±52.32 3515.88±2.57 11.000 < 0.001 中位数(10-6mm2/s) 15658.4±522.39 1015.62±522.72 14.97±1.88 15.21±2.34 12.019 < 0.001 10% 数值(10-6mm2/s) 19.64±2.69 15.31±2.4 818.45±11.92 619.17±22.38 7.615 < 0.001 90%数值(10-6mm2/s) 2119.98±522.7 2014.99±522.32 1819.56±522.29 1696.68±521.65 4.694 < 0.001 峰度 3.84±1.69 3. 85±2.32 3.84±1.67 3.91±1.02 0.852 0.254 均匀度 0.04±0.01 0.03±0.02 0.02±0.01 0.01±0.01 16.909 < 0.001
下载: 导出CSV
表 4 良性组以及恶性组患者的影像学特征比较
Table 4. Comparison of imaging characteristics between benign group and malignant group
特征 良性组(n=35) 恶性组(n=85) χ2/t P 肿瘤直径(cm, Mean±SD) 5.95±2.51 10.82±1.48 10.736 < 0.001 肿瘤形态(类圆形/不规则, n) 25/10 30/55 13.039 < 0.001 边界(清晰/模糊, n) 30/5 15/70 49.008 < 0.001 生长方式(腔内/腔外/混合, n) 10/11/14 25/30/30 0.264 0.876
下载: 导出CSV
表 5 不同危险度的患者的影像学特征比较
Table 5. Comparison of imaging characteristics of patients with different risks
特征 极低危险组(n=11) 低危险组(n=22) 中危险组(n=41) 高危险组(n=46) χ2/F P 肿瘤直径(cm, Mean±SD) 4.75±1.55 5.49±1.33 7.05±1.78 11.75±1.55 11.265 < 0.001 肿瘤形态(类圆形/不规则, n) 6/5 12/10 11/30 26/20 9.090 0.028 边界(清晰/模糊, n) 8/3 10/12 20/21 28/18 15.202 0.002 生长方式(腔内/腔外/混合, n) 3/4/4 7/8/7 12/11/18 13/18/15 2.037 0.916
下载: 导出CSV
-
[1] 毛海佳, 张冰倩, 黄亚男, 等. 基于磁共振表观扩散系数图像的放射组学特征评估胃肠道间质瘤危险度[J]. 中国医学影像学杂志, 2020, 28 (5): 390-3. https://www.cnki.com.cn/Article/CJFDTOTAL-ZYYZ202005017.htm [2] 高国超, 詹鹤凤, 岳松伟, 等. 肝脏原发性胃肠道间质瘤的影像表现及临床分析[J]. 临床放射学杂志, 2021, 40(9): 1741-5. https://www.cnki.com.cn/Article/CJFDTOTAL-LCFS202109019.htm [3] 张俊杰, 杨晓棠, 张建新, 等. 反应性结节状纤维性假瘤的影像表现及病理特征[J]. 中华放射学杂志, 2021, 55(10): 1096-8. [4] 李志坚, 王淑宝, 徐骥, 等. 胃肠道间质瘤的多排螺旋CT表现与病理及危险度分级的相关性分析[J]. 实用放射学杂志, 2021, 37(5): 794-8. [5] 张婧, 孙喆, 魏巍, 等. Ⅰ型神经纤维瘤病合并胃肠道外间质瘤1例[J]. 中国临床医学影像杂志, 2020, 31(10): 750-1. https://www.cnki.com.cn/Article/CJFDTOTAL-LYYX202010021.htm [6] Johansson A, Balter JM, Cao Y. Gastrointestinal 4D MRI with respiratory motion correction[J]. Med Phys, 2021, 48(5): 2521-7. [7] 姜书山. 胃肠间质瘤的MRI影像学征象研究及在其病理侵袭危险度评估中的应用探讨[J]. 中国医学创新, 2021, 18(2): 145-9. https://www.cnki.com.cn/Article/CJFDTOTAL-ZYCX202102038.htm [8] Yoo J, Kim SH, Han JK. Multiparametric MRI and 18F-FDG PET features for differentiating gastrointestinal stromal t-20, 30(3): 1634-43. [9] de Jonge CS, Sprengers AMJ, van Rijn KL, et al. Assessment of fasted and fed gastrointestinal contraction frequencies in healthy subjects using continuously tagged MRI[J]. Neurogastroenterol Motil, 2020, 32(2): e13747. [10] Mantese G. Gastrointestinal stromal tumor: epidemiology, diagnosis, and treatment[J]. Curr Opin Gastroenterol, 2019, 35(6): 555-9. [11] Li YF, Wang KN, Gao L, et al. Back propagation neural networkbased magnetic resonance imaging image features in treating intestinal obstruction in digestive tract diseases with Chengqi Decoction[J]. Contrast Media Mol Imaging, 2021, 2021: 1667024. [12] Inoue A, Furukawa A, Takaki K, et al. Noncontrast MRI of acute abdominal pain caused by gastrointestinal lesions: indications, protocol, and image interpretation[J]. Jpn J Radiol, 2021, 39(3): 209-24. [13] Nepal P, Wells M, Ojili V, et al. Problem-solving with MRI in acute abdominopelvic conditions, part 1: gastrointestinal, hepatobiliary, and pancreatic diseases[J]. Emerg Radiol, 2021, 28(6): 1161-72. [14] Barachini O, Bernt R, Mirzaei S, et al. The impact of 18F-FDOPAPET/MRI image fusion in detecting liver metastasis in patients with neuroendocrine tumors of the gastrointestinal tract[J]. BMC Med Imaging, 2020, 20(1): 22. [15] Kersemans V, Wallington S, Allen PD, et al. Manganese-free chow, a refined non-invasive solution to reduce gastrointestinal signal for T 1-weighted magnetic resonance imaging of the mouse abdomen [J]. Lab Anim, 2020, 54(4): 353-64. [16] Akahoshi K, Oya M, Koga T, et al. Current clinical management of gastrointestinal stromal tumor[J]. World J Gastroenterol, 2018, 24 (26): 2806-17. [17] Schaefer IM, Mariño-Enríquez A, Fletcher JA. What is new in gastrointestinal stromal tumor?[J]. Adv Anat Pathol, 2017, 24(5): 259-67. -

 点击查看大图
计量
- 文章访问数: 179
- HTML全文浏览量: 135
- PDF下载量: 8
- 被引次数: 0