


Construction of a nomogram model for predicting moderate to severe Crohn's disease based on CT enterography
-
摘要:
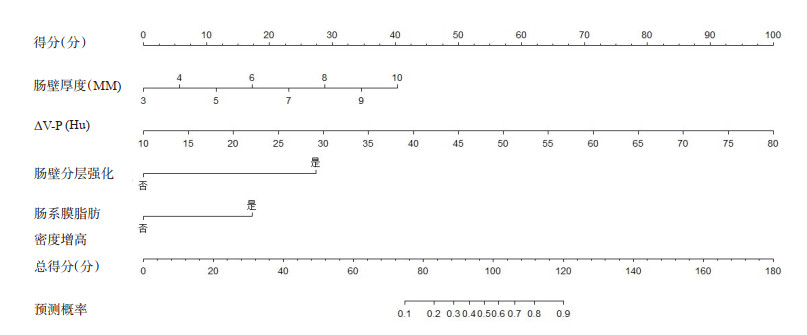
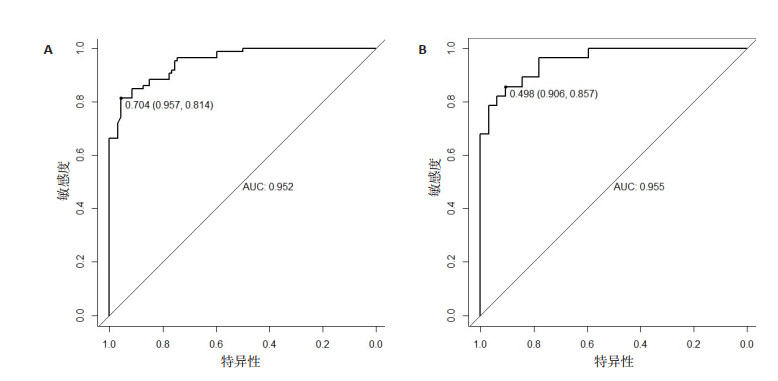
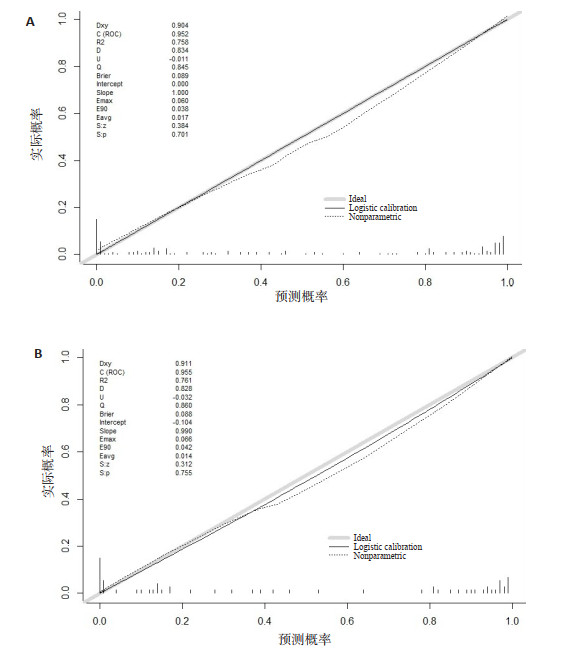
目的 探索中重度克罗恩病(CD)的CT小肠造影特征,构建预测中重度期CD的列线图。 方法 收集2019年1月~2022年6月期间扬州大学附属医院收治的180例CD患者,随机分为训练组(n=120)和验证组(n=60)。依据克罗恩病简化内镜评分评估CD的活动性,分为缓解、轻度期(n=94)、中重度期(n=86)。比较分析训练组和验证组不同分期CT小肠造影征象差异,并使用Rstudio4.1.2软件R包构建模型,绘制ROC曲线、校准曲线及临床决策曲线。 结果 二项Logistic回归分析CT小肠造影征象显示:肠壁厚度(OR=1.746,95% CI:1.085~2.811)、ΔV-P(ΔV-P =静脉期肠壁CT值-平扫肠壁CT值)(OR=1.148,95% CI:1.062~ 1.241)、肠壁分层强化(OR=14.183,95% CI:3.737~53.824)、肠系膜脂肪密度高(OR=5.332,95% CI:1.278~22.246)4个参数是诊断中重度度CD独立参数。模型在训练组和验证组ROC曲线下面积分别为0.952(95% CI:0.925~0.979,P < 0.05)、0.955(95% CI:0.911~0.997,P < 0.05),模型校准曲线与理想曲线贴合良好,决策曲线显示在一定阈值范围内患者净收益较大。 结论 肠壁厚度、ΔV-P、肠壁分层强化及肠系膜脂肪密度增高是诊断中重度期CD的独立因素,以此构建的列线图能够预测中重度期CD活动性。 -
关键词:
- 克罗恩病 /
- CT小肠造影 /
- Logistic回归 /
- 列线图
Abstract:Objective To explore the CT enterography characteristics of moderate to severe Crohn's disease (CD) and structure a nomogram to predict moderate to severe CD. Methods A total of 180 patients with CD admitted to the Affiliated Hospital of Yangzhou University from January 2019 to June 2022 were randomly divided into modeling group (n=120) and validation group (n=60). The activity of CD was assessed on the basis of the Simplified Endoscopic Score for Crohn's Disease and subsequently divided into two groups: remission to mild (n=94) and moderate to severe (n=86). The CT enterography signs of the diseased intestinal segment of the two groups were compared and analyzed. The model was constructed using R package of Rstudio4.1.2 software. ROC curve, calibration curve and clinical decision-making curve were drawn. Results Binomial Logistic regression analysis showed mural thickness (OR=1.746, 95% CI: 1.085-2.811), ΔV-P (difference in CT value of intestinal wall in venous phase and plain scan) (OR=1.148, 95% CI: 1.062-1.241), mural stratification and hyperenhancement (OR=14.183, 95%CI: 3.737-53.824) and increased mesenteric fat density (OR=5.332, 95% CI: 1.278-22.246) were independent parameters for the diagnosis of moderate to severe CD. The areas under the ROC curve of the model in the modeling group and the validation group was 0.952 (95% CI: 0.925-0.979, P < 0.05) and 0.955 (95% CI: 0.911-0.997, P < 0.05). The calibration curve of the model fitted well with the ideal curve, and the clinical decision-making curve has indicated large net benefit within a certain threshold range. Conclusion Mural thickness, ΔV-P, Mural stratification and hyperenhancement and Increased mesenteric fat density are independent parameters for determining moderate to severe stage of the disease and the correspondingly constructed nomogram can predict disease activity in moderate-to-severe CD. -

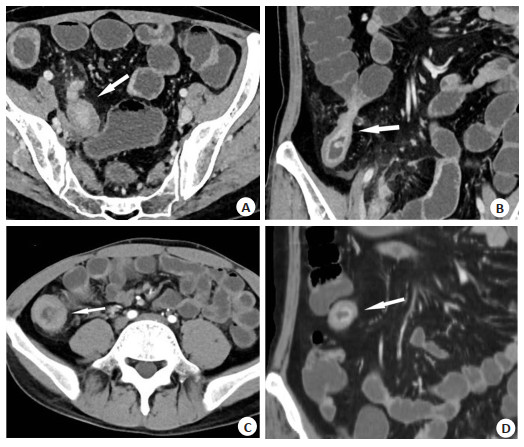
图 1 克罗恩病患者影像学表现
A~B: 患者女, 47岁, 克罗恩病重度期. A: 肠壁穿透性溃疡, 向腹腔内形成窦道; B: 小肠与横结肠之间形成瘘管(白箭); C: 患者男, 47岁, 克罗恩病轻度期, 肠壁轻度增厚伴均匀强化(白箭); D: 患者男, 28岁, 克罗恩病中度期, 患者肠壁增厚伴分层强化,肠壁黏膜明显强化(白箭).
Figure 1. Imaging findings of Crohn's disease patients.

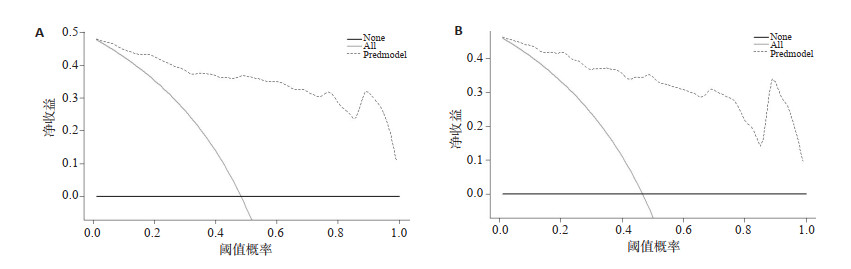
图 5 列线图的临床决策曲线分析
A: 训练组; B: 验证组.
Figure 5. Analysis of clinical decision curve of nomogram.
表 1 训练组CT征象单因素分析
Table 1. Single factor analysis of CT signs in training group
CTE征象 A组(n=62) B组(n=58) t/χ2 P 肠壁厚度(mm, Mean±SD) 5.10±1.29 7.34±1.60 -8.454a < 0.001 ΔA-P(Hu, Mean±SD) 37.76±12.91 50.40±18.95 -4.242a < 0.001 ΔV-P(Hu, Mean±SD) 41.11±12.61 58.53±10.40 -8.225 < 0.001 肠壁分层强化[n(%)] 1(17.7) 50(86.2) 56.203 < 0.001 梳齿征[n(%)] 34(54.8) 46(79.3) 8.076 < 0.001 肠管狭窄[n(%)] 5(8.1) 24(41.4) 18.148 < 0.001 肠系膜淋巴结增大[n(%)] 2(33.9) 26(44.8) 1.51 0.219 肠系膜脂肪密度增高[n(%)] 9(14.5) 24(41.4) 10.846 0.001 瘘管或窦道[n(%)] 15(24.2) 22(37.9) 2.652 0.103 腹腔脓肿[n(%)] 2(33.9) 6(44.8) 1.431b 0.232 a采用校正t检验, b采用连续校正χ2检验; A组: 缓解期和轻度活动期, B组: 中重度活动期; CTE: CT小肠造影.  下载: 导出CSV
表 2 验证组CT征象单因素分析
Table 2. Single factor analysis of CT signs in validation group
CTE征象 A组(n=32) B组(n=28) t/χ2 P 肠壁厚度(mm, Mean±SD) 5.03±1.26 7.43±1.35 -7.133 < 0.001 ΔA-P(Hu, Mean±SD) 27.28±12.82 47.79±19.41 -2.978 0.04 ΔV-P(Hu, Mean±SD) 40.78±12.61 57.89±10.26 -5.713 < 0.001 肠壁分层强化[n(%)] 6(14.3) 24(85.7) 26.786 < 0.001 梳齿征[n(%)] 18(56.3) 23(82.1) 4.627 0.031 肠管狭窄[n(%)] 4(12.5) 11(39.3) 5.714 0.017 肠系膜淋巴结增大[n(%)] 11(34.4) 15(53.6) 2.241 0.134 肠系膜脂肪密度增高[n(%)] 5(15.6) 13(46.4) 6.747 0.009 瘘管或窦道[n(%)] 7(21.9) 9(32.1) 0.805 0.317 腹腔脓肿[n(%)] 1(3.1) 3(10.7) 0.432b 0.511 b采用连续校正χ2检验.
下载: 导出CSV
表 3 CTE多因素Logistic回归分析结果
Table 3. Multi factor Logistic Regression Analysis Results of CTE
CTE参数 B 标准误 Wald P OR 95% CI 肠壁厚度 0.558 0.243 5.271 0.022 1.746 1.085~2.811 ΔV-P 0.138 0.040 12.162 < 0.001 1.148 1.062~1.241 肠壁分层强化 2.652 0.680 15.191 < 0.001 14.183 3.737~53.824 肠系膜脂肪密度高 1.674 0.729 5.275 0.022 5.332 1.278~22.246 常量 -12.479 2.714 21.145 < 0.001 0.000
下载: 导出CSV
-
[1] Gajendran M, et al. A comprehensive review and update on Crohn's disease[J]. Disease-a-Month, 2018, 64(2): 20-57. doi: 10.1016/j.disamonth.2017.07.001 [2] Li XH, Feng ST, Cao QH, et al. Degree of creeping fat assessed by computed tomography enterography is associated with intestinal fibrotic stricture in patients with Crohn's disease: a potentially novel mesenteric creeping fat index[J]. J Crohns Colitis, 2021, 15 (7): 1161-73. doi: 10.1093/ecco-jcc/jjab005 [3] Caiazzo A, Flashman K, Celentano V. Increased postoperative use of computed tomography following emergency surgery for ileocaecal crohn disease[J]. Surg Laparosc Endosc Percutan Tech, 2020, 30(3): 214-7. doi: 10.1097/SLE.0000000000000778 [4] Wold PB, Fletcher JG, Johnson CD, et al. Assessment of small bowel crohn disease: noninvasive peroral CT enterography compared with other imaging methods and endoscopy-feasibility study[J]. Radiology, 2003, 229(1): 275-81. doi: 10.1148/radiol.2291020877 [5] 王春龙, 韩丹, 黄益龙, 等. 双源CT双能量定量参数评价结肠克罗恩病活动度的可行性研究[J]. 中国临床医学影像杂志, 2018, 29(9): 640-4. https://www.cnki.com.cn/Article/CJFDTOTAL-LYYX201809011.htm [6] 郭亚慧, 牛巍巍, 张晓岚. 炎症性肠病诊断与治疗的共识意见(2018年, 北京): 克罗恩病部分解读[J]. 临床荟萃, 2018, 33(12): 1077-9, 1082. doi: 10.3969/j.issn.1004-583X.2018.12.016 [7] Sakurai T, et al. Mesenteric findings of CT enterography are well correlated with the endoscopic severity of Crohn's disease[J]. Eur J Radiol, 2017, 89: 242-8. doi: 10.1016/j.ejrad.2016.10.022 [8] 郭淑栋, 张贝贝, 丁孝民, 等. MRI小肠造影可评估克罗恩病活动度分级及临床活动指数[J]. 分子影像学杂志, 2021, 44(4): 618-23. doi: 10.12122/j.issn.1674-4500.2021.04.09 [9] Cantarelli BCF, de Oliveira RS, Alves AMA, et al. Evaluating inflammatory activity in Crohn's disease by cross-sectional imaging techniques[J]. Radiol Bras, 2020, 53(1): 38-46. doi: 10.1590/0100-3984.2018.0096 [10] Minordi LM, et al. A review of Magnetic Resonance Enterography classification and quantitative evaluation of active disease in patients with Crohn's disease[J]. Clin Imaging, 2021, 69: 50-62. doi: 10.1016/j.clinimag.2020.06.006 [11] Tolan DJM, Greenhalgh R, Zealley IA, et al. MR enterographic manifestations of small bowel Crohn disease[J]. Radiographics, 2010, 30(2): 367-84. doi: 10.1148/rg.302095028 [12] Masselli G, Gualdi G. CT and MR enterography in evaluating small bowel diseases: when to use which modality?[J]. Abdom Imaging, 2013, 38(2): 249-59. doi: 10.1007/s00261-012-9961-8 [13] Laterza L, Piscaglia AC, Minordi LM, et al. Multiparametric evaluation predicts different mid-term outcomes in Crohn's disease [J]. Dig Dis, 2018, 36(3): 184-93. doi: 10.1159/000487589 [14] Gauci J, Sammut L, Sciberras M, et al. Small bowel imaging in Crohn's disease patients[J]. Ann Gastroenterol, 2018, 31(4): 395-405. [15] Gajendran M, et al. A comprehensive review and update on Crohn's disease[J]. Disease-a-Month, 2018, 64(2): 20-57. doi: 10.1016/j.disamonth.2017.07.001 [16] Al-Hawary MM, Kaza RK, Platt JF. CT enterography: concepts and advances in Crohn's disease imaging[J]. Radiol Clin North Am, 2013, 51(1): 1-16. doi: 10.1016/j.rcl.2012.09.001 [17] 程静云, 谢辉, 杨昊, 等. CT小肠成像对克罗恩病活动性分级定量评估的价值[J]. 中华放射学杂志, 2018, 52(8): 608-13. https://cdmd.cnki.com.cn/Article/CDMD-10486-1019653820.htm [18] 方舒, 蒋政焱, 章伟, 等. CT小肠造影对克罗恩病活动性评估的Logistic回归分析[J]. 实用放射学杂志, 2018, 34(4): 549-52, 585. doi: 10.3969/j.issn.1002-1671.2018.04.016 [19] 张爱华, 刘新秀, 王承党, 等. 口服2.5%甘露醇溶液后小肠超声造影检查诊断小肠克罗恩病及其并发症[J]. 中国医学影像技术, 2022, 38 (4): 545-9. https://www.cnki.com.cn/Article/CJFDTOTAL-ZYXX202204013.htm [20] Park EK, Han NY, Park BJ, et al. Value of computerized tomography enterography in predicting Crohn's disease activity: correlation with Crohn's disease activity index and C-reactive protein[J]. Iran J Radiol, 2016, 13(4): e34301. [21] Li T, Liu Y, Guo J, et al. Prediction of the activity of Crohn's disease based on CT radiomics combined with machine learning models[J]. J Xray Sci Technol, 2022, 30(6): 1155-68. [22] 吴慧, 程静云, 王艳, 等. CT肠道成像定量评分系统在回结肠克罗恩病活动性评估中的应用价值[J]. 放射学实践, 2020, 35(1): 61-7. https://www.cnki.com.cn/Article/CJFDTOTAL-FSXS202001019.htm -

 点击查看大图
计量
- 文章访问数: 257
- HTML全文浏览量: 150
- PDF下载量: 11
- 被引次数: 0