

Predictive value of energy spectrum CT multimodal parameters combined with clinical parameters in gastric stromal tumor Ki-67
-
摘要:
目的 探索能谱CT多模态参数联合临床特征参数对胃间质瘤(GST)Ki-67的预测价值。 方法 回顾性分析2019年9月~2022年4月我院34例GST患者,依照其术后免疫组化Ki-67的百分比将患者进行分组,其中Ki-67≥6%为高表达组(n=15);Ki-67的百分比 < 6% 为低表达组(n=19)。行双源能谱CT扫描,测量及收集70 keV CT值、标准化碘浓度、能谱曲线斜率及临床特征等参数,并对上述数据与GST Ki-67表达进行相关性分析。 结果 直径、年龄与GST Ki-67高低表达组具有相关性(P < 0.05)。GST Ki-67低表达组的静脉期、延迟期能谱斜率值组内具有一定差异性(ICC < 0.75),其余各组参数组内差异性较小(ICC > 0.75)。除延迟期能谱斜率值组间差异无统计学意义(P > 0.05),其余各组参数组间差异均有统计学意义(P < 0.05)。动静脉期70 keV CT值、三期NIC、动脉期能谱斜率与GST的Ki-67表达呈正相关关系(P < 0.05);延迟期70 keV CT值、静脉期能谱曲线斜率与GST的Ki-67表达呈负相关关系(P < 0.05)。动静脉期70 keV CT值、三期NIC、动脉期能谱斜率预测GST的Ki-67表达的效果较好,其中静脉期NIC的AUC值最高为0.984。 结论 三期70 keV CT值、NIC值、动静脉期能谱斜率及直径、年龄在预测GST Ki-67表达中具有一定的价值。 Abstract:Objective To explore the predictive value of energy spectrum CT multimodal parameters combined with clinical characteristic parameters for gastric stromal tumor (GST) Ki-67. Methods Thirty-four patients with gastric stromal tumor in our hospital who met the inclusion criteria from September 19 to February 22, 2019 were retrospectively analyzed. The patients were divided into groups according to the percentage of Ki-67 in postoperative immunohistochemistry. Ki-67 percentage ≥6% was high expression group (n=15), and Ki-67 < 6% was low expression group (n=19). Dual-source CT scan was performed to measure and collect 70 keV CT value, standardized iodine concentration, energy spectrum curve slope and clinical characteristics, and the correlation between the above data and the expression of Ki-67 in gastric stromal tumor was analyzed. Results The correlation between diameter, age and GST Ki-67 expression was significant (P < 0.05). The lag period NIC value and energy spectrum slope of GST Ki-67 low expression group had some differences within the group (ICC < 0.75), and the other parameters had small differences within the group (ICC > 0.75). Except for the energy spectrum slope value of delay period, there were no significant differences between groups (P > 0.05), other parameters were significantly different between groups (P < 0.05). Ki-67 expression in GST was positively correlated with 70keVCT value in arteriovenous phase, NIC in arterial phase and energy spectrum slope (P < 0.05). Ki-67 expression of GST was negatively correlated with 70 keV CT value in delayed period and slope of energy spectrum curve in venous period (P < 0.05). The expression of Ki-67 in GST was predicted by 70 keV CT value of arteriovenous phase, NIC of phase iii and energy spectrum slope of arterial phase, and the highest AUC value of NIC in venous phase was 0.984. Conclusion The three-phase 70 keV CT value, NIC value, energy spectrum slope and diameter of arteriovenous phase and age have certain value in predicting the expression of GST Ki-67. -
Key words:
- gastric stromal tumor /
- energy spectrum CT /
- clinical characteristic parameters /
- Ki-67
-

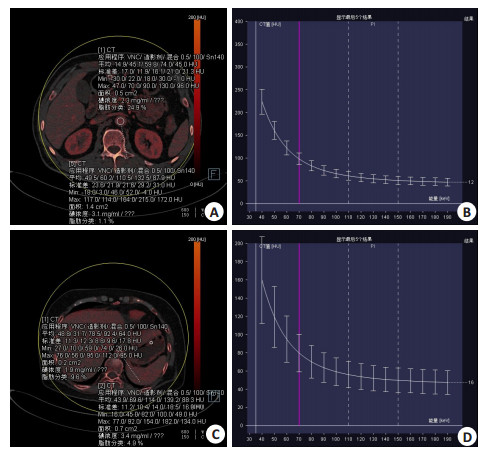
图 1 高、低表达组患者静脉期NIC、能谱斜率测量结果
A~B: 高表达组患者静脉期NIC、能谱斜率测量结果分别为0.74、3.1; C~D: 低表达组患者静脉期NIC、能谱斜率测量结果分别为0.56、2.0.
Figure 1. The measurement results of NIC and energy spectrum slope in venous phase of patients with high and low expression.

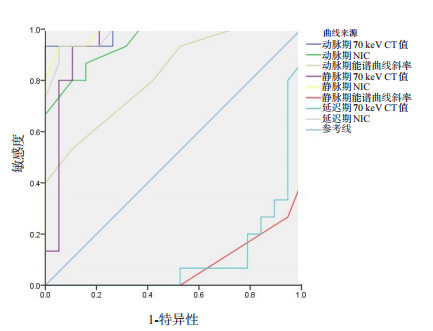
图 2 各组参数值预测GST的Ki-67表达的ROC分析
Figure 2. ROC analysis of Ki-67 expression of GST predicted by each parameter value.
表 1 患者临床特征与高低表达组的相关性检验
Table 1. Correlation test between clinical characteristics and high and low expression group (n)
因素 高表达组(n=15) 低表达组(n=19) P 临床症状 0.616 腹部不适及出血 13 16 无临床症状 2 3 边界 0.116 模糊 6 3 清晰 9 16 淋巴结 0.187 转移 2 0 无转移 13 19 囊变 0.199 有囊变 5 2 无囊变 10 17 直径(cm) 0.036 > 2 10 5 ≤ 2 5 14 年龄(岁) 0.014 ≥ 60 11 5 < 60 4 14  下载: 导出CSV
表 2 高表达组各参数测量结果的一致性比较
Table 2. Consistency comparison of measurement results of each parameter in the high expression group (Mean±SD)
指标 观察者1 观察者2 ICC 70 keV CT值 动脉期 68.720±5.755 67.927±6.312 0.989 静脉期 72.933±4.712 72.980±4.467 0.982 延迟期 66.113±3.517 64.567±1.940 0.799 NIC值 动脉期 0.554±0.054 0.562±0.062 0.959 静脉期 0.597±0.049 0.600±0.058 0.925 延迟期 0.634±0.058 0.626±0.059 0.888 能谱斜率 动脉期 2.780±0.243 2.687±0.311 0.891 静脉期 2.980±0.211 2.807±0.269 0.941 延迟期 2.853±0.196 2.893±0.279 0.877 ICC: 组内相关系数; NIC: 标准化碘值.
下载: 导出CSV
表 3 低表达组各参数测量结果的一致性比较
Table 3. Consistency comparison of measurement results of each parameter in the low expression group (Mean±SD)
指标 观察者1 观察者2 ICC 70keVCT值 动脉期 53.979±3.799 53.963±7.030 0.804 静脉期 58.816±6.913 57.553±6.649 0.995 延迟期 73.947±5.406 73.400±5.489 0.979 NIC值 动脉期 0.431±0.060 0.422±0.066 0.927 静脉期 0.452±0.058 0.462±0.059 0.985 延迟期 0.489±0.057 0.476±0.056 0.918 能谱斜率 动脉期 2.484±0.214 2.463±0.209 0.951 静脉期 3.390±0.188 3.390±0.182 0.707 延迟期 2.900±0.141 2.874±0.368 0.614
下载: 导出CSV
表 4 高表达组与低表达组各组参数差异性比较
Table 4. Comparison of parameter differences between the high expression group and the low expression group (Mean±SD)
一般资料 高表达组(n=15) 低表达组(n=19) t P 70 keV CT值 动脉期 68.720±5.755 53.979±3.799 8.993 < 0.001 静脉期 72.933±4.712 58.816±6.913 6.757 < 0.001 延迟期 66.113±3.517 73.947±5.406 -4.852 < 0.001 NIC值 动脉期 0.554±0.054 0.431±0.060 6.216 < 0.001 静脉期 0.597±0.049 0.452±0.058 7.782 < 0.001 延迟期 0.634±0.058 0.489±0.057 7.298 < 0.001 能谱斜率 动脉期 2.780±0.243 2.484±0.214 3.772 0.001 静脉期 2.980±0.211 3.390±0.188 -4.378 < 0.001 延迟期 2.853±0.196 2.900±0.141 -0.807 0.426
下载: 导出CSV
表 5 各组参数值与GST的Ki-67表达相关性分析
Table 5. Correlation analysis between each parameter value and Ki-67 expression of GST
参数 r P 70 keV CT值 动脉期 0.846 < 0.001 静脉期 0.767 < 0.001 延迟期 -0.651 < 0.001 NIC值 动脉期 0.740 < 0.001 静脉期 0.809 < 0.001 延迟期 0.790 < 0.001 能谱斜率 动脉期 0.555 0.001 静脉期 -0.726 < 0.001
下载: 导出CSV
表 6 各组参数值预测GST的Ki-67表达的ROC分析
Table 6. ROC analysis of Ki-67 expression predicted by each parameter value of GST
参数 AUC 界值 敏感度 特异性 70 keV CT值 动脉期 0.982 61.30 0.933 0.824 静脉期 0.937 64.75 0.933 1.000 延迟期 0.104 NIC值 动脉期 0.944 0.49 0.867 0.842 静脉期 0.984 0.54 0.933 0.947 延迟期 0.977 0.57 0.933 0.947 能谱斜率 动脉期 0.818 2.75 0.533 0.895 静脉期 0.074
下载: 导出CSV
-
[1] Pantaleo MA, Tarantino G, Agostinelli C, et al. Immune microenvironment profiling of gastrointestinal stromal tumors (GIST) shows gene expression patterns associated to immune checkpoint inhibitors response[J]. Oncoimmunology, 2019, 8(9): e1617588. doi: 10.1080/2162402X.2019.1617588 [2] 顾怡瑾, 李安琪, 董磊, 等. 原发、复发及转移胃肠道间质瘤KIT及PDGFRA突变与临床病理特征间的关系[J]. 诊断学理论与实践, 2021, 20(3): 257-64. https://www.cnki.com.cn/Article/CJFDTOTAL-ZDLS202103007.htm [3] Hedenström P, Andersson C, Sjövall H, et al. Pretreatment tumor DNA sequencing of KIT and PDGFRA in endosonography-guided biopsies optimizes the preoperative management of gastrointestinal stromal tumors[J]. Mol Diagn Ther, 2020, 24(2): 201-14. doi: 10.1007/s40291-020-00451-0 [4] 罗春材, 李涛, 杨立. 双层探测器能谱CT的特点及临床应用[J]. 中国医疗设备, 2021, 36(7): 170-3. doi: 10.3969/j.issn.1674-1633.2021.07.038 [5] 任学智, 何鹏, 龙邹荣, 等. 基于全卷积金字塔残差网络的能谱CT图像降噪研究[J]. 光谱学与光谱分析, 2021, 41(9): 2950-5. https://www.cnki.com.cn/Article/CJFDTOTAL-GUAN202109056.htm [6] Liu JL, Chai YJ, Zhou JL, et al. Spectral computed tomography imaging of gastric schwannoma and gastric stromal tumor[J]. J ComputAssist Tomogr, 2017, 41(3): 417-21. doi: 10.1097/RCT.0000000000000548 [7] Wang JP, Liu L, Li ZA, et al. Ki-67 labelling index is related to the risk classification and prognosis of gastrointestinal stromal tumours: a retrospective study[J]. Gastroenterol Hepatol, 2021, 44(2): 103-14. doi: 10.1016/j.gastrohep.2020.05.022 [8] Liu XC, Qiu HB, Zhang P, et al. Ki-67 labeling index may be a promising indicator to identify "very high-risk" gastrointestinal stromal tumor: a multicenter retrospective study of 1022 patients[J]. Hum Pathol, 2018, 74: 17-24. doi: 10.1016/j.humpath.2017.09.003 [9] Zhang XL, Bai LC, Wang D, et al. Gastrointestinal stromal tumor risk classification: spectral CT quantitative parameters[J]. Abdom Radiol (NY), 2019, 44(7): 2329-36. doi: 10.1007/s00261-019-01973-w [10] Chen LF, Fu GZ, Huang DP, et al. Value of dual-energy CT-based volumetric iodine-uptake in the evaluation of chemotherapy efficacy in advanced gastric cancer[J]. Chin J Gastrointest Surg, 2019, 22 (10): 977-83. [11] 张学凌, 赵建洪, 张玲艳, 等. 能谱CT参数对胃肠道间质瘤危险度分级的初步研究[J]. 实用放射学杂志, 2016, 32(12): 1880-3. doi: 10.3969/j.issn.1002-1671.2016.12.015 [12] 于珊珊, 张极峰, 管莹, 等. 能谱CT定量参数与胃肠道间质瘤肿瘤危险度的关系[J]. 现代消化及介入诊疗, 2019, 24(4): 442-4. doi: 10.3969/j.issn.1672-2159.2019.04.030 [13] 王燕, 黄晓俊. 胃肠道间质瘤的诊断策略及其临床价值分析[J]. 现代消化及介入诊疗, 2021, 26(3): 397-401, 405. doi: 10.3969/j.issn.1672-2159.2021.03.026 [14] 杜静, 卢桂芳, 马文慧, 等. 胃间质瘤临床特征及免疫组化结果与危险度分级的相关性[J]. 现代肿瘤医学, 2022, 30(7): 1255-9. https://www.cnki.com.cn/Article/CJFDTOTAL-SXZL202207022.htm [15] 王泽涛, 陈剑通, 尚国印. Ki67免疫组化染色指数与胃间质瘤临床病理特征及预后的关系[J]. 哈尔滨医科大学学报, 2019, 53(5): 513-6. https://www.cnki.com.cn/Article/CJFDTOTAL-HYDX201905018.htm [16] 王学东, 刘爱连, 田士峰, 等. 单源双能CT能谱分析定量参数预测胃间质瘤Ki-67表达的可行性研究[J]. 放射学实践, 2020, 35(7): 893-9. https://www.cnki.com.cn/Article/CJFDTOTAL-FSXS202007019.htm [17] 原士超, 赵庆, 范红燕. 双能CT对胃间质瘤中Ki-67表达的预测价值及其与病理参数的关系[J]. 临床荟萃, 2021, 36(11): 1013-8. doi: 10.3969/j.issn.1004-583X.2021.11.011 [18] 李梦颖, 金凤强, 李智勇, 等. 肺浸润性腺癌能谱CT碘基物质分析与Ki-67表达的相关性研究[J]. 临床放射学杂志, 2017, 36(2): 204-8. https://www.cnki.com.cn/Article/CJFDTOTAL-LCFS201702013.htm [19] He MY, Zhang R, Peng ZP, et al. Differentiation between gastrointestinal schwannomas and gastrointestinal stromal tumors by computed tomography[J]. Oncol Lett, 2017, 13(5): 3746-52. -

 点击查看大图
计量
- 文章访问数: 131
- HTML全文浏览量: 42
- PDF下载量: 5
- 被引次数: 0