


Effect of different reconstruction algorithms for ultra-low dose chest CT on quantitative detection of pneumonia and image quality
-
摘要:
目的 探讨胸部超低剂量CT扫描条件下滤波反投影、自适应统计迭代重建、深度学习图像重建(DLIR)等不同重建算法对人工智能影像辅助肺炎定量分析(uAI-Discover-NCP)和图像质量的影响。 方法 纳入陕西中医药大学附属医院2023年7月~2023年12月就诊的43例肺炎复查患者,采用个性化超低剂量CT扫描,原始数据分别采用滤波反投影、40%强度的自适应统计迭代重建、不同强度DLIR(DLIR-M、DLIR-H)、在DLIR-H处理上叠加E2的边缘强化(DLIR-H+E2)重建图像,共获得5组图像。测量5组图像空气、肺组织、胸主动脉、左肩胛下肌、胸10椎体的CT值、噪声值,计算信噪比。2位医师对5组图像肺整体质量及肺炎显示进行5分制主观评分。将图像导入CT影像辅助肺炎定量分析软件进行独立分析,记录肺炎指数、肺炎体积及肺炎体积百分比、肺炎质量及肺炎质量百分比。采用重复测量方差分析或Friedman秩和检验比较各组定量参数及主观评分的差异。 结果 5组图像在肺实质、胸主动脉、左肩胛下肌、胸10椎体组织CT值差异均无统计学意义(P>0.05);而各组织噪声及信噪比的总体差异均有统计学意义(P < 0.05),其中DLIR-H组的图像噪声最低、信噪比最高,与其他4组相比,差异均有统计学意义(P < 0.05)。2位医师对各组图像的主观评分一致性高(Kappa=0.811~0.894),5组图像的整体图像质量、肺炎显示评分总体差异有统计学意义(P < 0.001),DLIR-H与DLIR-H+E2组整体图像质量、肺炎显示主观评分最高,组间差异无统计学意义(P>0.05)。5个肺炎定量参数(肺炎指数、肺炎体积及肺炎体积百分比、肺炎质量及肺炎质量百分比)组间总体差异均无统计学意义(P> 0.05)。 结论 超低剂量扫描条件下,影像辅助肺炎定量分析结果不受重建算法的影响。与滤波反投影、自适应统计迭代重建40%相比,高强度深度学习图像重建能显著降低图像噪声、明显提升图像质量,在临床诊断有较大的优势。 Abstract:Objective To investigate the effect of different image reconstruction algorithms, including filtered back projection, adaptive statistical iterative reconstruction V and deep learning image reconstruction (DLIR) on AI- assisted quantitative analysis of pneumonia (uAI-Discover-NCP) and image quality under ultra-low dose chest CT scanning conditions. Methods Fourty-three patients undergoing follow-up for pneumonia from July to December 2023 at the Affiliated Hospital of Shaanxi University of Chinese Medicine were included in this study. Each patient underwent personalized ultra-low dose CT scanning. The raw data were reconstructed using filtered back projection, 40% intensity adaptive statistical iterative reconstruction V, various intensities of DLIR (DLIR-M, DLIR-H), and DLIR-H with additional E2 edge enhancement (DLIR-H+E2), resulting in five groups of images. Measurements were taken for CT values and noise values in the ROIs-air, lung tissue, thoracic aorta, left subscapularis muscle, and thoracic vertebra 10. The signal-to-noise ratio was calculated. Two physicians subjectively rated the overall quality and pneumonia presentation of the five groups of images on a 5-point scale. The images were independently analyzed using CT image-assisted pneumonia quantitative analysis software, recording pneumonia index, pneumonia volume and its percentage, and pneumonia quality and its percentage. Repeated measures ANOVA or Friedman's rank-sum test were used to compare quantitative parameters and subjective scores among groups. Results There was no significant difference in CT values of the lung parenchyma, thoracic aorta, left subscapularis muscle, and thoracic vertebra 10 across the five image groups (P>0.05). However, differences in noise values and signal-to-noise ratio among tissues were statistically significant (P < 0.05), with the DLIR- H group demonstrating the lowest image noise and highest signal- to- noise ratio, significantly outperforming the others four groups (P < 0.05). The consistency of subjective scoring by the two physicians was high (Kappa= 0.811- 0.894). There was a significant difference in overall image quality and pneumonia presentation scores across the five groups (P < 0.001), with the highest scores in the DLIR-H and DLIR-H+E2 groups, although the difference between these groups was not significant (P>0.05). There was no significant difference in the overall variation of the five pneumonia quantitative parameters among the groups (P>0.05). Conclusion Under ultra-low dose scanning conditions, AI-assisted quantitative analysis of pneumonia is not affected by the reconstruction algorithm. Compared to filtered back projection and 40% adaptive statistical iterative reconstruction V, high- intensity DLIR significantly reduces image noise and noticeably improves image quality, offering substantial clinical diagnostic advantages. -

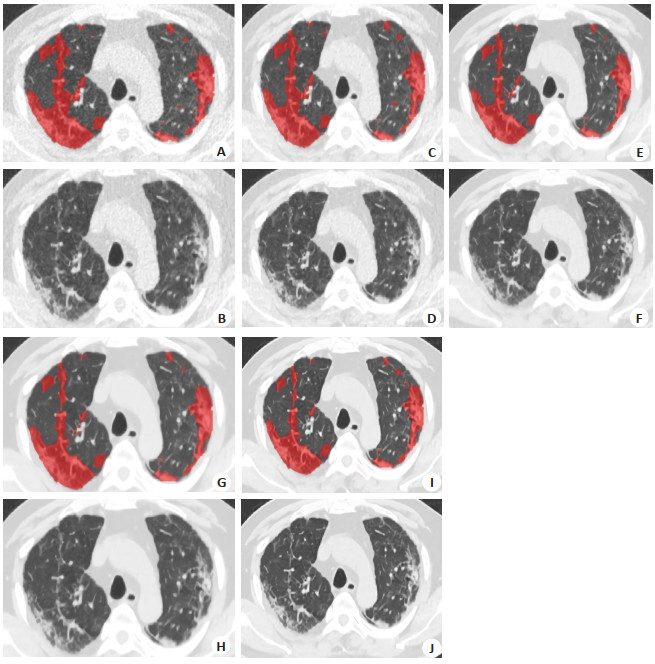
图 1 一位66岁男性患者不同重建算法所得的胸部CT肺窗图及肺炎定量分析图
Figure 1. Lung window diagram of chest CT and quantitative analysis diagram of pneumonia obtained from different reconstruction algorithms in a 66-year-old male patient. A, B: FBP images; C, D: ASIR-V40% images; E, F: DLIR-M images; G, H: DLIR-H images; I, J: DLIR-H +E2 images. A, C, E, G, I: Quantitative analysis maps of pneumonia. The software automatically segmented the lesions. The segmentation range of pneumonia lesions are basically the same; B, D, F, H, J: Lung window maps, and the overall quality score of H and J was the highest, all with 5 points.

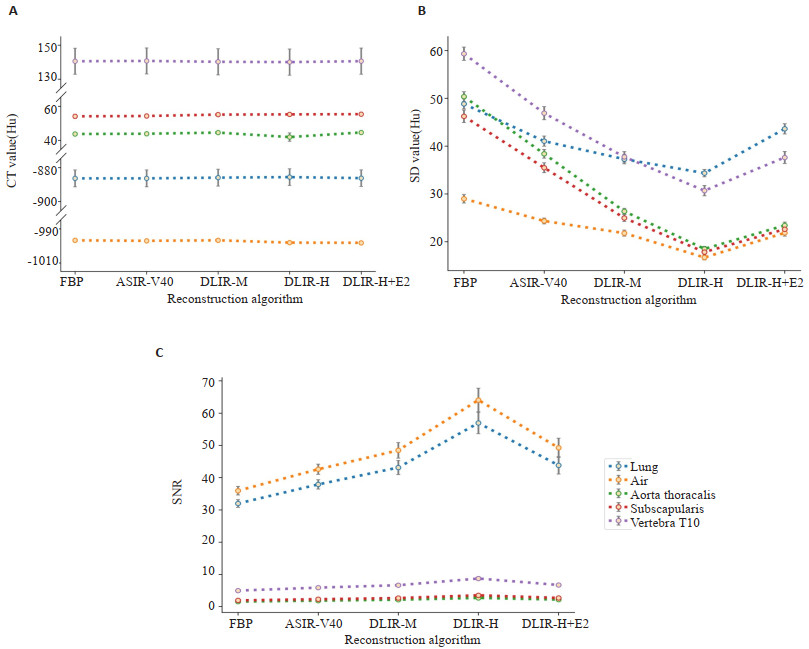
图 2 不同算法所得图像各组织CT、SD、SNR值的折线误差棒图
Figure 2. Line plots with error bar of CT, SD and SNR values of each tissue of images obtained by different algorithms. A: CT value; B: SD value; C: SNR.
表 1 肺炎病灶显示主观评分标准
Table 1. Subjective scoring criteria for pneumonia lesion presentation
5-point system The showing of the pneumonia lesion 1 The lesion and boundary cannot be determined and cannot be diagnosed 2 The lesion is vaguely visible and the diagnosis is limited 3 The lesion is visible, and the internal and marginal structures showed unclearly 4 The internal and marginal structures of the lesion appeared well displayed 5 The lesion is clearly visible, the internal and marginal structures are clearly displayed  下载: 导出CSV
表 2 不同重建算法所得图像各组织CT、SD、SNR及主观评分的比较
Table 2. Comparison of CT, SDR, SNR and subjective scores of various tissues in images obtained by different reconstruction algorithms
Variable FBP ASIR-V40% DLIR-M DLIR-H DLIR-H+E2 F/χ2 P CT Lung -894.46(36.27) -894.61(37.54) -894.84(33.46) -893.80(33.53) -893.98(30.72) 6.642 0.156 Air -996.70±3.92 -997.00±4.12 -996.69±3.62 -998.06±3.31 -998.16±3.44 46.939 < 0.001 Aorta 43.77±6.45 43.92±6.19 44.86±5.62 43.63(7.67) 44.68±5.66 0.796 0.381 Subscapalaris 54.13±8.05 54.35±7.58 55.17±7.17 55.30±7.06 55.43±7.15 3.476 0.062 T10 140.51±50.48 140.70±50.45 140.20±50.85 140.03±50.96 140.57±51.00 0.990 0.364 SD Lung 48.83±6.98 41.03±7.01 37.27±6.52 34.35±5.11 43.62±7.07 159.647 < 0.001 Air 29.30(4.68) 25.06(4.68) 22.38(4.89) 17.26(3.73) 22.92(4.72) 157.823 < 0.001 Aorta 50.35±6.85 38.39±6.06 26.61(3.65) 18.50±3.45 23.41±4.55 172.000 < 0.001 Subscapalaris 46.23±8.61 35.48±6.93 24.95±4.77 17.84±4.02 22.61±4.80 168.316 < 0.001 T10 59.32±9.20 46.07(9.81) 37.75±7.28 30.68±7.16 36.53(10.30) 163.405 < 0.001 SNR Lung 30.42(5.00) 36.18(7.20) 39.82(8.56) 51.72(8.86) 38.96(7.91) 15.717 < 0.001 Aorta 1.53(0.45) 1.86(0.47) 2.01(0.62) 2.63(0.75) 1.98(0.62) 11.427 < 0.001 Subscapalaris 1.90(0.49) 2.29(0.64) 2.56(0.46) 3.29(0.62) 2.49(0.60) 20.593 < 0.001 T10 4.76(2.84) 5.78±2.18 6.30(3.82) 7.92(5.28) 6.19(4.01) 11.558 < 0.001 Subjective scoring Overall 2(0) 3(0) 4(0) 5(0) 5(0) 172.000 < 0.001 Pneumonia 3(0) 3(0) 3(0) 5(0) 5(1) 169.225 < 0.001 SD: Standard deviation; SNR: Signal to noise ratio; FBP: Filtered back projection; ASIR-V40%: Adaptive statistical iterative reconstruction V at 40% intensity;DLIR-M: Deep learning image reconstruction at medium strength; DLIR-H: Deep learning image reconstruction at high strength; DLIR-H+E2: Deep learning image reconstruction at high strength with additional post-processing using an edge-enhancement filter E2.
下载: 导出CSV
表 3 不同重建算法所得图像肺炎定量参数的比较
Table 3. Comparison of quantitative parameters of pneumonia in images obtained by different reconstruction algorithms
Parameter FBP ASIR-V40% DLIR-M DLIR-H DLIR-H+E2 F/χ2 P PI 32.49±16.82 33.59±15.96 33.20±15.44 33.46±15.04 33.01±14.74 1.282 0.284 TLeV 155.38±244.22 160.56±248.89 151.86±229.17 153.18±229.02 157.80±250.17 8.638 0.071 TLeV% 1.50(4.1) 1.50(4.2) 1.50(4.0) 1.50(4.1) 1.60(5.4) 6.918 0.140 LQ 74.21±113.16 75.30±113.57 72.72±107.97 73.09±107.69 73.93±111.07 6.057 0.195 LQ% 2.70(8.0) 3.0(8.2) 2.80(7.8) 2.90(7.9) 3.90(8.3) 3.505 0.477 PI: Pneumonia index; TLeV: Total lung lesion volume; TLeV% : Percentage of total lung lesion volume; LQ: Lesion quality; LQ% : Percentage of lesion quality.
下载: 导出CSV
-
[1] 中华医学会放射学分会. 新型冠状病毒肺炎的放射学诊断: 中华医学会放射学分会专家推荐意见(第一版)[J]. 中华放射学杂志, 2020, 54(4): 279-85. doi: 10.3760/cma.j.cn112149-20200205-00094 [2] Brenner DJ, Hall EJ. Computed tomography: an increasing source of radiation exposure[J]. N Engl J Med, 2007, 357(22): 2277-84. doi: 10.1056/NEJMra072149 [3] Koetzier LR, Mastrodicasa D, Szczykutowicz TP, et al. Deep learning image reconstruction for CT: technical principles and clinical prospects[J]. Radiology, 2023, 306(3): e221257. doi: 10.1148/radiol.221257 [4] 高才良, 郎春辉, 李翔, 等. 新型冠状病毒肺炎不同临床分型首次胸部CT评分及临床表现[J]. 中国医学影像学杂志, 2020, 28(11): 806-9. doi: 10.3969/j.issn.1005-5185.2020.11.002 [5] Xu X, Yu CC, Qu J, et al. Imaging and clinical features of patients with 2019 novel coronavirus SARS-CoV-2[J]. Eur J Nucl Med Mol Imaging, 2020, 47(5): 1275-80. doi: 10.1007/s00259-020-04735-9 [6] Zuo YH, Chen Y, Chen LH, et al. Computed Tomography scanning in patients with COVID‑19: artificial intelligence analysis of lesions volume and outcome[J]. Eur Rev Med Pharmacol Sci, 2023, 27(12): 5869-77. [7] 唐友发, 王秋霞, 张进华. 深度学习重建算法在肠系膜上动脉CT血管成像中的应用评估[J]. 暨南大学学报: 自然科学与医学版, 2023, 44(3): 316-22. https://www.cnki.com.cn/Article/CJFDTOTAL-JNDX202303011.htm [8] Mileto A, Guimaraes LS, McCollough CH, et al. State of the art in abdominal CT: the limits of iterative reconstruction algorithms[J]. Radiology, 2019, 293(3): 491-503. doi: 10.1148/radiol.2019191422 [9] Garg M, Devkota S, Prabhakar N, et al. Ultra-low dose CT chest in acute COVID‑19 pneumonia: a pilot study from India[J]. Diagnostics, 2023, 13(3): 351. doi: 10.3390/diagnostics13030351 [10] Greffier J, Hamard A, Pereira F, et al. Image quality and dose reduction opportunity of deep learning image reconstruction algorithm for CT: a phantom study[J]. Eur Radiol, 2020, 30(7): 3951-9. doi: 10.1007/s00330-020-06724-w [11] Toia GV, Zamora DA, Singleton M, et al. Detectability of small low‑attenuation lesions with deep learning CT image reconstruction: a 24‑reader phantom study[J]. AJR Am J Roentgenol, 2023, 220(2): 283-95. doi: 10.2214/AJR.22.28407 [12] 张卓璐, 陈菁, 刘卓, 等. 深度学习重建算法对肺部CT定量分析及图像质量的影响[J]. 放射学实践, 2023, 38(4): 434-40. https://www.cnki.com.cn/Article/CJFDTOTAL-FSXS202304014.htm [13] 中国肥胖问题工作组. 中国成人超重和肥胖症预防与控制指南(节录)[J]. 营养学报, 2004, 26(1): 1-4. https://www.cnki.com.cn/Article/CJFDTOTAL-YYXX200401004.htm [14] Deak PD, Smal Y, Kalender WA. Multisection CT protocols: sex- and age-specific conversion factors used to determine effective dose from dose-length product[J]. Radiology, 2010, 257(1): 158-66. doi: 10.1148/radiol.10100047 [15] 宋兰, 田杜雪, 王金华, 等. 胸部超低剂量CT应用深度学习重建行肺癌筛查的可行性研究[J]. 中华放射学杂志, 2022, 56(6): 667-72. [16] Jiang JM, Miao L, Liang X, et al. The value of deep learning image reconstruction in improving the quality of low-dose chest CT images[J]. Diagnostics, 2022, 12(10): 2560. doi: 10.3390/diagnostics12102560 [17] Racine D, Becce F, Viry A, et al. Task-based characterization of a deep learning image reconstruction and comparison with filtered back-projection and a partial model-based iterative reconstruction in abdominal CT: a phantom study[J]. Phys Med, 2020, 76: 28-37. doi: 10.1016/j.ejmp.2020.06.004 [18] 刘海法, 杨丽, 王琦, 等. 深度学习重建算法对胸部低剂量CT肺结节测量及显示影响的模体研究[J]. 放射学实践, 2023, 38(8): 977-84. https://www.cnki.com.cn/Article/CJFDTOTAL-FSXS202308004.htm [19] Svalkvist A, Fagman E, Vikgren J, et al. Evaluation of deep-learning image reconstruction for chest CT examinations at two different dose levels[J]. J Appl Clin Med Phys, 2023, 24(3): e13871. doi: 10.1002/acm2.13871 [20] Gieraerts C, Dangis A, Janssen L, et al. Prognostic value and reproducibility of AI-assisted analysis of lung involvement in COVID-19 at low-dose submillisievert chest CT: sample size implications for clinical trials[J]. Radiol Cardiothorac Imag, 2020, 2(5): e200441. doi: 10.1148/ryct.2020200441 -

 点击查看大图
计量
- 文章访问数: 21
- HTML全文浏览量: 9
- PDF下载量: 4
- 被引次数: 0