


Value of high-resolution CT radiomics model in differentiating glandular precursor lesions and minimally invasive adenocarcinoma presenting as subcentimeter pure ground glass nodules
-
摘要:
目的 探讨基于高分辨CT影像组学模型鉴别表现为亚厘米肺纯磨玻璃结节的腺体前驱病变和微浸润腺癌(MIA)的价值。 方法 回顾性分析2020年7月~2022年4月经手术病理证实的亚厘米纯磨玻璃结节患者共计68例(75个肺结节),包括6个非典型腺瘤样增生、26个原位癌及43个MIA,根据病理类型分为腺体前驱病变组(非典型腺瘤样增生+原位癌)和微浸润组(MIA),将其分为训练组54例(60个pGGN),验证组14例(15个pGGN)。采集临床资料(年龄、性别)、CT定性参数(边界、毛刺、分叶、支气管异常征、内部血管征、空泡征、胸膜牵拉征)及定量参数(最长径、最短径、平均CT值、最大CT值、最小CT值)。利用ITK-SNAP软件对每个纯磨玻璃结节行手动分割并导入AK软件进行影像特征提取。采取单因素及多因素分析方法筛选出训练组中两亚组之间差异有统计学意义的变量,利用多元Logistic回归的方法构建影像组学模型、临床特征模型及联合模型。通过ROC曲线及计算曲线下面积(AUC)对各模型的预测效能进行比较,使用Delong's检验比较各模型之间的差异。采用校正曲线及决策曲线分析评估联合模型的校准度及临床应用性,采用Hosmer-Lemeshow检验分析联合模型预测值与观测值之间的拟合程度。 结果 联合模型在训练组和验证组中均具有最高的诊断效能(训练组AUC=0.857,95% CI:0.764~0.951,P < 0.0001;验证组AUC=0.84,95% CI:0.592~1.000,P=0.0071),高于影像组学模型(训练组AUC=0.835,95% CI:0.735~0.935,P < 0.0001;验证组AUC=0.82,95% CI:0.563~1.000,P=0.0145)和临床特征模型(训练组AUC=0.764,95% CI:0.636~0.864,P < 0.0001;验证组AUC=0.63,95% CI:0.347~0.913,P=0.3677)。联合模型在训练组和验证组中的预测观察值与实际观察值之间均具有良好的一致性。 结论 基于高分辨CT影像组学和临床特征构建的联合模型有助于术前鉴别表现为亚厘米肺纯磨玻璃结节的腺体前驱病变和MIA,提升肺结节诊治及管理水平。 Abstract:Objective To assess the efficacy of a radiomics model rooted in high-resolution CT imaging for the differentiation of precursor glandular lesions and minimally invasive adenocarcinoma (MIA) manifesting as subcentimeter pure ground-glass nodules (pGGN). Methods A total of 68 patients (75 pulmonary nodules) with subcentimeter pGGN confirmed by surgical pathology from July 2020 to April 2022 were retrospectively analyzed, including 6 atypical adenomatous hyperplasia (AAH), 26 adenocarcinoma in situ (AIS) and 43 MIA. According to the pathological type, the patients were divided into precursor glandular lesions group (AAH+AIS) and minimally invasive group (MIA), including 54 cases in the training group (60 pGGN) and 14 cases in the validation group (15 pGGN). Clinical data (age, gender), CT qualitative parameters (margin, spiculation, lobulation, air bronchogram, internal vseesl sign, bubblen, pleural attachment) and quantitative parameters (longest diameter, shortest diameter, average CT value, maximum CT value, minimum CT value) were collected. Manual segmentation of each pGGN was performed using ITK-SNAP software, and image features were extracted using AK software. Statistical analyses included univariate and multivariate methods to identify significant differences between the two subgroups in the training group. We used these analyses to create imaging radiomics models, clinical models, and combined models through multivariate Logistic regression. The prediction efficiency of each model was compared by ROC curve and the area under the curve (AUC), and Delong's test was used to compare whether there were significant differences among the models. The calibration curve and the decision curve analysis were used to evaluate the calibration and clinical application of the combined model, and Hosmer-Lemeshow test was used to analyze the fitting degree between the predicted value and the observed value of the combined model. Results The combined model had highest diagnostic efficiency in both the training group and the text group (AUC=0.857, 95% CI: 0.764-0.951, P < 0.0001 in the training group; AUC=0.84, 95% CI: 0.592-1.000, P=0.0071 in the text group), which was higher than the radiomics model (AUC=0.835, 95% CI: 0.735-0.935, P < 0.0001 in the training group; AUC=0.82, 95% CI: 0.563-1.000, P=0.0145 in the text group) and clinical model (AUC=0.764, 95% CI: 0.636-0.864, P < 0.0001 in the training group; AUC=0.63, 95% CI: 0.347~0.913, P=0.3677 in the text group). Furthermore, the combined model demonstrated a commendable degree of consistency between its predicted values and actual observations in both the training and text group. Conclusion The combined model based on CT radiomics and clinical features is helpful to distinguish precursor glandular lesions and MIA which presenting as subcentimeter pure ground glass nodules before operation, and improve the level of diagnosis, treatment and management of pulmonary nodules. -

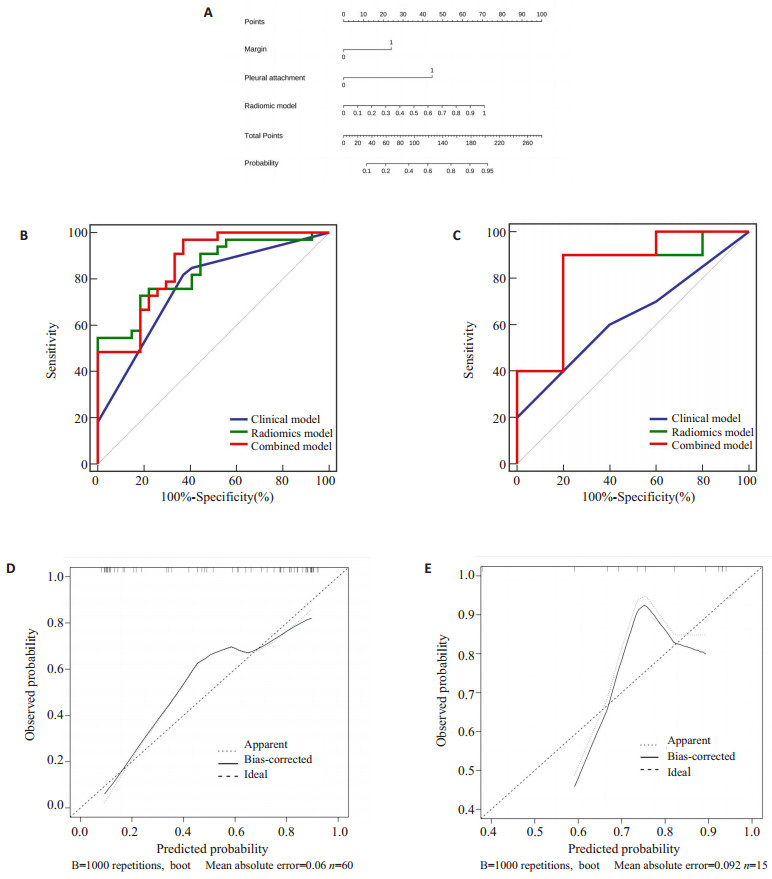
图 2 联合模型Nomogram图及模型评估
Figure 2. Nomogram of the combined model and model evaluation. A: Based on the data of the training group, the Nomograms were statistically analyzed and concluded to be composed of radiomic model and CT qualitative parameters (margin and pleural attachment), which can realize the differential diagnosis of glandular precursor lesions (AAH+AIS) and MIA. B: ROC curve of the training group combined model; C: ROC curve of the test group combined mode; D: Calibration curve of training group's combined model; E: Calibration curve of the test group's combined model.

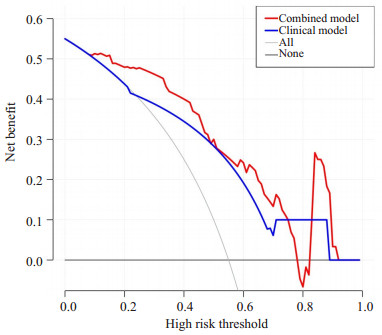
图 3 联合模型的决策曲线分析图
Figure 3. DCA curve plot of the combined model. The red line represents the combined model, and the blue line represents the clinical model. The horizontal coordinate is the risk probability, and the vertical coordinate is the net profit rate of the model. The black horizontal line and the gray curve represent two extreme curves.
表 1 两组一般资料比较
Table 1. Comparison of general data between the two groups
General data Training group (n=60) P Text group (n=15) P AAH+AIS MIA AAH+AIS MIA Gender [n(%)] 0.333 0.505 Male 5(16.7) 7(29.2) 2(40.0) 1(11.1) Female 25(83.3) 17(70.8) 3(60.0) 8(88.9) Age (year, Mean±SD) 51.71±11.72 50.83±10.459 0.773 52.2±10.26 45.33±8.66 0.207 AAH: Atypical adenomatous hyperplasia; AIS: Adenocarcinoma in situ; MIA: Minimally invasive.  下载: 导出CSV
表 2 CT定性及定量参数单因素分析结果
Table 2. Results of single factor analysis of CT qualitative and quantitative parameters
CT parameters Training group (n=60) P Text group (n=15) P AAH+AIS (n=27) MIA(n=33) AAH+AIS(n=5) MIA(n=10) Qualitative parameters [n(%)] Margin 10(37.0) 27(81.8) < 0.001 2(40.0) 6(60.0) 0.464 Lobulation 3(11.1) 11(33.3) 0. 043 2(40.0) 3(30.0) 0.699 Spiculation 0(0) 2(6.1) 0.193 0(0) 1(10.0) 0.464 Bubble 4(14.8) 4(12.1) 0.760 2(40.0) 2(20.0) 0.409 Air bronchogram 1(3.7) 6(18.2) 0.082 0(0) 1(10.0) 0.464 Vessel change 13(48.1) 22(66.7) 0.148 4(80.0) 6(60.0) 0.439 Pleural attachment 1(3.7) 7(21.2) 0.047 1(20.0) 3(30.0) 0.680 Quantitative parameters (Mean±SD) Longest diameter 6.89±1.78 8.12±1.90 0.013 8.4±3.13 8.4±1.51 >0.999 Shortest diameter 5.96±1.56 6.82±1.67 0.046 7.6±2.70 7.05±1.26 0.592 Total volume 218.23±195.33 309.35±186.27 0.070 375.28±321.07 408.04±195.85 0.808 Maximum CT value -199.04±181.10 106.15±309.72 < 0.001 -180.6±214.72 17.5±300.79 0.215 Minimum CT value -813.15±120.37 -834.33±234.27 0.672 -923.2±103.08 -880.7±108.42 0.480 Average CT value -557.03±85.74 -428.39±193.75 0.001 -645.42±52.168 -503.41±168.76 0.032
下载: 导出CSV
表 3 多因素Logistic回归分析结果
Table 3. Results of multivariate Logistic regression analysis
CT parameters β SE Wald χ2 OR 95% CI P Margin 2.096 0.939 4.987 8.134 1.292-51.205 0.026 Lobulation 1.195 0.984 1.476 3.303 0.480-22.712 0.224 Pleural attachment 3.191 1.506 4.491 24.318 1.271-465.333 0.034 Longest diameter 0.858 0.492 3.043 2.359 0.899-6.187 0.081 Shortest diameter -0.419 0.563 0.554 2.359 0.899-6.187 0.457 Maximum CT value 0.002 0.002 0.732 1.002 0.998-1.006 0.392 Average CT value 0.007 0.004 3.164 1.007 0.999-1.015 0.075
下载: 导出CSV
表 4 各组模型在训练组和测试组中的鉴别诊断效能
Table 4. Differential diagnostic efficacy of each model in training group and test group.
Model Training group (n=60) Text group (n=15) AUC(95% CI) Sensitivity(%) Specificity(%) P AUC(95% CI) Sensitivity(%) Specificity(%) P Combined model 0.857(0.764-0.951) 96.97 62.69 < 0.0001 0.84(0.592-1.000) 90 80 0.0071 Radiomic model 0.835(0.735-0.935) 54.55 100 < 0.0001 0.82(0.563-1.000) 90 80 0.0145 Clinical model 0.764(0.636-0.864) 81.82 62.96 < 0.0001 0.63(0.347-0.913) 60 60 0.3677
下载: 导出CSV
-
[1] Chen WQ, Zheng RS, Zhang SW, et al. Cancer incidence and mortality in China in 2013: an analysis based on urbanization level[J]. Chin J Cancer Res, 2017, 29(1): 1-10. doi: 10.21147/j.issn.1000-9604.2017.01.01 [2] World Health Organization (2021). WHO Classification of tumours of the lung[EB/OL]. [2021-06-10]. https://tumourclassification.iarc.who.int .[3] She YL, Zhang L, Zhu HY, et al. The predictive value of CT-based radiomics in differentiating indolent from invasive lung adenocarcinoma in patients with pulmonary nodules[J]. Eur Radiol, 2018, 28(12): 5121-8. doi: 10.1007/s00330-018-5509-9 [4] Ishida H, Shimizu Y, Sakaguchi H, et al. Distinctive clinicopathological features of adenocarcinoma in situ and minimally invasive adenocarcinoma of the lung: a retrospective study[J]. Lung Cancer, 2019, 129: 16-21. doi: 10.1016/j.lungcan.2018.12.020 [5] National Lung Screening Trial Research Team, Aberle DR, Adams AM, et al. Reduced lung-cancer mortality with low-dose computed tomographic screening[J]. N Engl J Med, 2011, 365(5): 395-409. doi: 10.1056/NEJMoa1102873 [6] Liu SL, Wang R, Zhang Y, et al. Precise diagnosis of intraoperative frozen section is an effective method to guide resection strategy for peripheral small- sized lung adenocarcinoma[J]. J Clin Oncol, 2016, 34(4): 307-13. doi: 10.1200/JCO.2015.63.4907 [7] Yeh YC, Nitadori JI, Kadota K, et al. Using frozen section to identify histological patterns in stage Ⅰ lung adenocarcinoma of≤3 Cm: accuracy and interobserver agreement[J]. Histopathology, 2015, 66(7): 922-38. doi: 10.1111/his.12468 [8] Wu F, Tian SP, Jin X, et al. CT and histopathologic characteristics of lung adenocarcinoma with pure ground-glass nodules 10 mm or less in diameter[J]. Eur Radiol, 2017, 27(10): 4037-43. doi: 10.1007/s00330-017-4829-5 [9] Lee SM, Park CM, Goo JM, et al. Invasive pulmonary adenocarcinomas versus preinvasive lesions appearing as ground-glass nodules: differentiation by using CT features[J]. Radiology, 2013, 268(1): 265-73. doi: 10.1148/radiol.13120949 [10] Mao HX, Labh K, Han FS, et al. Diagnosis of the invasiveness of lung adenocarcinoma manifesting as ground glass opacities on high-resolution computed tomography[J]. Thorac Cancer, 2016, 7 (1): 129-35. doi: 10.1111/1759-7714.12269 [11] Jiang YN, Che SY, Ma SC, et al. Radiomic signature based on CT imaging to distinguish invasive adenocarcinoma from minimally invasive adenocarcinoma in pure ground-glass nodules with pleural contact[J]. Cancer Imaging, 2021, 21(1): 1. doi: 10.1186/s40644-020-00376-1 [12] Meng Y, Liu CL, Cai Q, et al. Contrast analysis of the relationship between the HRCT sign and new pathologic classification in small ground glass nodule-like lung adenocarcinoma[J]. La Radiol Med, 2019, 124(1): 8-13. doi: 10.1007/s11547-018-0936-x [13] Song L, Xing TT, Zhu ZC, et al. Hybrid clinical-radiomics model for precisely predicting the invasiveness of lung adenocarcinoma manifesting as pure ground-glass nodule[J]. Acad Radiol, 2021, 28 (9): e267-77. doi: 10.1016/j.acra.2020.05.004 [14] 高琳, 张晶, 顾慧, 等. CT特征预测基于2021年肺肿瘤新分类肺纯磨玻璃结节浸润性及浸润程度的价值[J]. 中华放射学杂志, 2022, 56 (6): 616-22. doi: 10.3760/cma.j.cn112149-20210707-00641 [15] Zhu YQ, Liu CH, Mo Y, et al. Radiomics for differentiating minimally invasive adenocarcinoma from precursor lesions in pure ground- glass opacities on chest computed tomography[J]. Br J Radiol, 2022, 95(1134): 20210768. doi: 10.1259/bjr.20210768 [16] Liu CL, Zhang F, Cai Q, et al. Establishment of a predictive model for surgical resection of ground- glass nodules[J]. J Am Coll Radiol, 2019, 16(4): 435-45. doi: 10.1016/j.jacr.2018.09.043 [17] Xiang WJ, Xing YF, Jiang S, et al. Morphological factors differentiating between early lung adenocarcinomas appearing as pure ground- glass nodules measuring ≤10 mm on thin- section computed tomography[J]. Cancer Imaging, 2014, 14(1): 33. doi: 10.1186/s40644-014-0033-x [18] Fan L, Fang MJ, Li ZB, et al. Radiomics signature: a biomarker for the preoperative discrimination of lung invasive adenocarcinoma manifesting as a ground-glass nodule[J]. Eur Radiol, 2019, 29(2): 889-97. doi: 10.1007/s00330-018-5530-z [19] Sun YL, Li C, Jin L, et al. Radiomics for lung adenocarcinoma manifesting as pure ground- glass nodules: invasive prediction[J]. Eur Radiol, 2020, 30(7): 3650-9. doi: 10.1007/s00330-020-06776-y [20] Wu T, Dai Y. Tumor microenvironment and therapeutic response [J]. Cancer Lett, 2017, 387: 61-8. doi: 10.1016/j.canlet.2016.01.043 [21] Beig N, Khorrami M, Alilou M, et al. Perinodular and intranodular radiomic features on lung CT images distinguish adenocarcinomas from granulomas[J]. Radiology, 2019, 290(3): 783-92. doi: 10.1148/radiol.2018180910 [22] Nishino M. Perinodular radiomic features to assess nodule microenvironment: does it help to distinguish malignant versus benign lung nodules?[J]. Radiology, 2019, 290(3): 793-5. doi: 10.1148/radiol.2018182619 -

 点击查看大图
计量
- 文章访问数: 23
- HTML全文浏览量: 8
- PDF下载量: 2
- 被引次数: 0