


Correlation between ultrasonic image manifestations of breast cancer and serum carcinoembryonic antigen, carbohydrate antigen 125, carbohydrate antigen 50
-
摘要:
目的 分析乳腺癌超声声像图表现与血清癌胚抗原(CEA)、糖类抗原(CA)125、CA50表达的相关性。 方法 回顾分析2020年6月~2022年9月于医院收治的100例疑似乳腺癌患者的病历资料,所有病例均接受超声检查,根据病灶病理检查结果分为恶性组(n=52)、良性组(n=48),分析恶性组患者的超声声像图特征分布情况,化学发光免疫法检测患者血清CEA、CA125、CA50水平,比较超声声像图不同特征下乳腺癌患者的血清CEA、CA125、CA50水平变化并分析其相关性,比较恶性组、良性组患者血清CEA、CA125、CA50水平并分析其对乳腺癌的诊断价值。 结果 恶性组超声声像图中表现出肿块≥2 cm、形态不规则、边缘毛刺征、纵横比 > 1、内部低/混合回声、后方回声衰减、微小钙化、病灶内富血供患者占比均高于良性组(P < 0.05)。超声声像图中肿块大小(≥2 cm vs < 2 cm)、纵横比(≤1 vs > 1)、内部回声(低/混合回声vs高/等回声)、后方回声(衰减vs无衰减)、微小钙化(有vs无)、病灶内血流分布(富血供vs乏血供)患者的血清CEA、CA125、CA50水平的差异有统计学意义(P < 0.05),不规则形态乳腺癌患者血清CEA、CA50水平均高于规则形态乳腺癌患者(P < 0.05),边缘毛刺征乳腺癌患者血清CA125、CA50水平均高于边缘无毛刺征乳腺癌患者(P < 0.05)。血清CEA、CA125、CA50水平与超声声像图特征中的纵横比 > 1、微小钙化、病灶内富血供呈正相关关系(r纵横比 > 1=0.415、0.341、0.424,r微小钙化=0.374、0.394、0.311;r病灶内富血供=0.419、0.533、0.461,P < 0.05)。恶性组血清CEA、CA125、CA50水平分别为9.36±2.16 ng/mL、46.84±7.66 U/mL、42.61±6.48 μg/L,均高于良性组的6.9±2.04 ng/mL、38.73±8.82 U/mL、36.70±6.87 μg/L(P < 0.05)。血清CEA、CA125、CA50及其联合检测时的AUC分别为0.845、0.760、0.721、0.910,三项指标联合检测的AUC均高于其单独检测(ZCEA/联合=2.109,P=0.035;ZCA125/联合=3.232,P=0.001;ZCA50/联合=3.821,P < 0.001)。 结论 血清CEA、CA125、CA50水平与乳腺癌超声声像图特征中的肿块大小、微小钙化、病灶内富血供关系密切,其联合检测具有乳腺癌辅助诊断价值。 Abstract:Objective To analyze the correlation between ultrasonic image manifestations of breast cancer and serum carcinoembryonic antigen (CEA), carbohydrate antigen (CA) 125, CA50. Methods A retrospective analysis was performed on the case data of 100 patients with suspected breast cancer admitted to the hospital from June 2020 to September 2022. All patients underwent ultrasound examination. According to the results of pathological examination, they were divided into malignant group (n=52) and benign group (n=48). The characteristics of ultrasonic images in malignant group were analyzed. The levels of serum CEA, CA125 and CA50 were detected by chemiluminescence immunoassay. The changes of CEA, CA125 and CA50 in patients with different ultrasonic image characteristics were compared, and their correlation was analyzed. The levels of serum CEA, CA125 and CA50 in malignant group and benign group were compared, and their diagnostic value for breast cancer was analyzed. Results The proportions of cases with tumor ≥2 cm, irregular morphology, marginal spiculation, aspect ratio > 1, internal low/mixed echo, posterior echo attenuation, micro-calcification and abundant blood supply of lesions in malignant group were higher than those in benign group (P < 0.05). There were significant differences in levels of serum CEA, CA125 and CA50 among patients with different ultrasonic image characteristics [tumor size (≥2 cm vs < 2 cm), aspect ratio (≤1 vs > 1), internal echo (low/mixed echo vs high/equal echo), posterior echo (attenuation vs non-attenuation), micro-calcification (yes vs no), blood flow distribution (abundant blood supply vs lack of blood supply] (P < 0.05). The levels of serum CEA and CA50 in patients with irregular morphology of breast cancer were higher than those with regular morphology (P < 0.05). The levels of serum CA125 and CA50 in patients with marginal spiculation were higher than those without marginal spiculation (P < 0.05). The levels of serum CEA, CA125 and CA50 were positively correlated with aspect ratio > 1, micro-calcification and abundant blood supply of lesions (raspect ratio > 1=0.415, 0.341, 0.424; rmicro-calcification=0.374, 0.394, 0.311; rabundant blood supply of lesions=0.419, 0.533, 0.461, P < 0.05). The levels of serum CEA, CA125 and CA50 in malignant group were 9.36±2.16 ng/mL, 46.84±7.66 U/mL and 42.61±6.48 μg/L, higher than those in benign group (6.9±2.04 ng/mL, 38.73±8.82 U/mL, 36.70±6.87 μg/L, P < 0.05). AUC values of serum CEA, CA125, CA50 and combined detection were 0.845, 0.760, 0.721 and 0.910, respectively. AUC of combined detection was greater than that of single index (ZCEA/combination=2.109, P=0.035; ZCA125/combination=3.232, P=0.001; ZCA50/combination=3.821, P < 0.001). Conclusion The serum CEA, CA125 and CA50 are closely related to ultrasonic image characteristics of breast cancer (tumor size, micro- calcification, abundant blood supply of lesions), and their combined detection has auxiliary diagnosis value for breast cancer. -

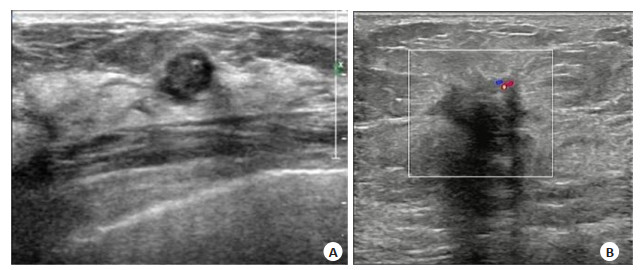
图 1 乳腺癌患者和乳腺良性病变患者超声声像图
Figure 1. Ultrasonic images in patients with breast cancer and those with benign breast lesions. A: Case 1, a 1.1 cm×0.9 cm hypoechoic mass in the upper quadrant of the right breast with posterior effect enhancement, intraductal papilloma by pathological diagnosis. B: Case 2, a hypoechoic mass in the left breast at 12 o'clock, 2.1 cm×2.4 cm×1.9 cm in size, unclear boundary, irregular morphology, marginal spiculation, attenuation of posterior echo, short strip blood flow signals by CDFI, grade II invasive ductal carcinoma of the left breast by pathological diagnosis.

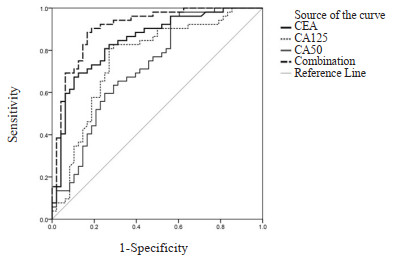
图 2 血清CEA、CA125、CA50水平对乳腺癌诊断ROC
Figure 2. ROC curves of serum CEA, CA125 and CA50 in the diagnosis of breast cancer.
表 1 恶性组、良性组病例超声声像图特征比较
Table 1. Comparison of ultrasonic image characteristics between malignant group and benign group [n(%)]
Ultrasonic image characteristics Benign group (n=48) Malignant group (n=52) χ2 P Tumor size (cm) 7.207 0.007 ≥2 14(29.14) 29(55.77) < 2 34(23.34) 23(44.23) Morphology 10.117 0.001 Regular 30(16.30) 16(30.77) Irregular 18(36.18) 36(69.23) Marginal spiculation 9.974 0.002 Yes 8(24.8) 24(46.15) No 40(28.40) 28(53.85) Aspect ratio 10.35 0.001 ≤1 38(25.38) 25(48.08) > 1 10(27.10) 27(51.92) Internal echo 5.584 0.018 Low/mixed echo 8(19.80) 19(36.54) High/equal echo 40(33.40) 33(63.46) Posterior echo 4.245 0.039 Attenuation 11(22.11) 22(42.31) Non-attenuation 37(30.37) 30(57.69) Micro-calcification 5.342 0.021 Yes 7(18.70) 18(34.62) No 41(34.41) 34(65.38) Blood flow distribution in lesions 4.461 0.035 Abundant blood supply 10(21.10) 21(40.38) Lack of blood supply 38(31.38) 31(59.62)  下载: 导出CSV
表 2 超声声像图不同特征下乳腺癌患者血清CEA、CA125、CA50水平比较
Table 2. Comparison of serum CEA, CA125 and CA50 levels in breast cancer patients with different ultrasonic image characteristics (Mean±SD)
Ultrasonic image characteristics CEA(ng/mL) t/P CA125(U/mL) t/P CA50(μg/L) t/P Tumor size (cm) 4.753/ < 0.001 6.195/ < 0.001 6.205/ < 0.001 ≥2 (n=29) 10.58±1.86 51.36±3.18 44.95±3.19 < 2 (n=23) 7.82±2.33 45.89±3.14 39.66±2.87 Morphology 5.131/ < 0.001 1.775/0.082 3.15/0.003 Regular (n=16) 7.14±2.11 47.82±2.91 39.76±3.79 Irregular (n=36) 10.35±2.07 49.44±3.09 43.88±4.56 Marginal spiculation 1.746/0.087 3.521/0.001 5.194/ < 0.001 Yes (n=24) 9.98±2.33 50.69±3.28 45.01±3.23 No (n=28) 8.83±2.40 47.44±3.35 40.55±2.96 Aspect ratio 5.142/ < 0.001 4.421/ < 0.001 7.166/ < 0.001 ≤1 (n=25) 7.34±2.62 46.98±3.17 39.14±3.41 > 1 (n=27) 11.23±2.85 50.75±2.98 45.82±3.31 Internal echo 5.889/ < 0.001 6.348/ < 0.001 7.286/ < 0.001 Low/mixed echo (n=19) 11.61±1.95 52.67±3.10 46.57±3.15 High/equal echo (n=33) 8.06±2.17 46.79±3.28 40.33±2.87 Posterior echo 4.201/ < 0.001 5.897/ < 0.001 3.661/0.001 Attenuation (n=22) 10.76±2.02 51.94±3.00 44.79±3.96 Non-attenuation (n=30) 8.33±2.09 46.74±3.24 41.01±3.46 Micro-calcification 2.575/0.013 5.779/ < 0.001 4.120/ < 0.001 Yes (n=18) 10.34±1.83 52.48±2.69 46.09±4.23 No (n=34) 8.84±2.08 47.07±3.45 40.77±4.53 Blood flow distribution in lesions 2.581/0.013 10.155/ < 0.001 3.695/0.001 Abundant blood supply (n=21) 10.36±2.54 53.88±3.15 44.55±3.13 Lack of blood supply (n=31) 8.68±2.13 45.59±2.70 41.30±3.10 CEA: Carcinoembryonic antigen; CA125: Carbohydrate antigen 125; CA50: Carbohydrate antigen 50.
下载: 导出CSV
表 3 恶性组、良性组血清CEA、CA125、CA50水平比较
Table 3. Comparison of serum CEA, CA125 and CA50 levels between malignant group and benign group (Mean±SD)
Group CEA(ng/mL) CA125(U/mL) CA50(μg/L) Malignant group (n=52) 9.36±2.16 46.84±7.66 42.61±6.48 Benign group (n=48) 6.9±2.04 38.73±8.82 36.70±6.87 t 5.772 4.919 4.394 P < 0.001 < 0.001 < 0.001
下载: 导出CSV
表 4 血清CEA、CA125、CA50水平对乳腺癌的诊断效能分析
Table 4. Diagnostic efficiency of serum CEA, CA125 and CA50 for breast cancer
Index Cut-off values AUC 95% CI Sensitivity(%) Specificity(%) CEA 8.875 0.845 0.768-0.923 67.31 89.58 CA125 42.515 0.760 0.663-0.858 80.77 72.92 CA50 37.155 0.721 0.620-0.822 96.15 60.42 Combination - 0.910 0.852-0.968 84.62 83.33
下载: 导出CSV
-
[1] Xia CF, Dong XS, Li H, et al. Cancer statistics in China and United States, 2022: profiles, trends, and determinants[J]. Chin Med J (Engl), 2022, 135(5): 584-90. doi: 10.1097/CM9.0000000000002108 [2] Burstein HJ, Curigliano G, Thürlimann B, et al. Customizing local and systemic therapies for women with early breast cancer: the St. Gallen International Consensus Guidelines for treatment of early breast cancer 2021[J]. Ann Oncol, 2021, 32(10): 1216-35. doi: 10.1016/j.annonc.2021.06.023 [3] Cui H, Zhang DD, Peng FH, et al. Identifying ultrasound features of positive expression of Ki67 and P53 in breast cancer using radiomics[J]. Asia Pac J Clin Oncol, 2021, 17(5): e176-e184. [4] 刘平贤, 张浩, 李伟汉, 等. 乳腺癌根治术后手术部位感染对肿瘤标志物与纤溶凝血功能及上肢淋巴水肿的影响[J]. 中华医院感染学杂志, 2021, 31(23): 3571-5. https://www.cnki.com.cn/Article/CJFDTOTAL-ZHYY202123011.htm [5] Einama T, Yamagishi Y, Takihata Y, et al. Co-expression of mesothelin and CA125/MUC16 is a prognostic factor for breast cancer, especially in luminal-type breast cancer patients[J]. Biomark Res, 2021, 9(1): 78. doi: 10.1186/s40364-021-00335-3 [6] Li HY, Li LX, Sun JM, et al. Value of TCT combined with serum CA153 and CA50 in early diagnosis of cervical cancer and precancerous lesions[J]. Pak J Med Sci, 2022, 38(6): 1471-6. [7] 管玲, 王丽云, 段颖, 等. 超声造影联合超声BI-RADS分级在乳腺癌诊断中的应用[J]. 第三军医大学学报, 2014, 36(13): 1430-3. https://www.cnki.com.cn/Article/CJFDTOTAL-DSDX201413023.htm [8] Adler DD, Carson PL, Rubin JM, et al. Doppler ultrasound color flow imaging in the study of breast cancer: preliminary findings[J]. Ultrasound Med Biol, 1990, 16(6): 553-9. doi: 10.1016/0301-5629(90)90020-D [9] 何美情, 王娟, 刘波, 等. 乳腺癌组织中HER-2的表达与肿瘤超声声像图特征的相关性[J]. 现代肿瘤医学, 2021, 29(20): 3565-8. doi: 10.3969/j.issn.1672-4992.2021.20.011 [10] 吕琪, 吴军刚, 贾春梅, 等. 年轻女性乳腺浸润性导管癌及其不同分子亚型的超声声像图特征分析[J]. 中国全科医学, 2020, 23(3): 358-62. https://www.cnki.com.cn/Article/CJFDTOTAL-QKYX202003024.htm [11] 左玮玮, 齐赛, 刘一航. 乳腺癌X线边缘毛刺征、边缘分叶征与患者生物学因子水平及分子分型的关系[J]. 中国医疗设备, 2022, 37(12): 82-6. https://www.cnki.com.cn/Article/CJFDTOTAL-YLSX202212017.htm [12] 韩敏, 路红, 马文娟, 等. 彩色多普勒超声对乳腺癌微钙化的诊断价值及微钙化与预后的关系[J]. 中国现代医学杂志, 2021, 31(22): 85-90. https://www.cnki.com.cn/Article/CJFDTOTAL-ZXDY202122016.htm [13] 张瑾晖, 王丹, 姜珏, 等. 非特殊型浸润性乳腺癌声像图特征与P53表达的相关性分析[J]. 中国超声医学杂志, 2021, 37(8): 862-5. https://www.cnki.com.cn/Article/CJFDTOTAL-ZGCY202108007.htm [14] 林金锌, 陈洁琼. 不同病理分期乳腺癌患者血清CA153表达差异与超声特征的相关性研究[J]. 中国肿瘤临床与康复, 2021, 28(4): 458-61. https://www.cnki.com.cn/Article/CJFDTOTAL-ZGZK202104028.htm [15] 李琰, 潘华锋, 向泉, 等. 微小核糖核酸34a、糖类抗原15-3和糖类抗原125联合检测在乳腺癌复发转移监测中的价值[J]. 中华实验外科杂志, 2022, 39(1): 124-6. [16] 张雁, 刘松岭, 周爱凤, 等. 乳腺癌患者血清因子水平与疾病的相关性研究[J]. 中国肿瘤临床与康复, 2022, 29(4): 412-5. https://www.cnki.com.cn/Article/CJFDTOTAL-ZGZK202204007.htm [17] 王秀梅. VEGF和CEA在乳腺癌中的表达及与血管生成的关系[J]. 基因组学与应用生物学, 2020, 39(5): 2311-7. https://www.cnki.com.cn/Article/CJFDTOTAL-GXNB202005050.htm [18] 徐海飞, 陈金笑, 王瑶. 超声造影参数在乳腺癌临床诊断中的价值及与血清肿瘤标志物表达的关系[J]. 中国医师杂志, 2020, 22(12): 1817-21. [19] Li X, Bai F, Wei X, et al. Genome-wide association study of serum tumor markers in Southern Chinese Han population[J]. BMC Cancer, 2022, 22(1): 160-8. [20] 周成礼, 黄嵘. 超声和MRI影像学及影像组学在乳腺癌中的研究进展[J]. 分子影像学杂志, 2022, 45(4): 621-6. doi: 10.12122/j.issn.1674-4500.2022.04.29 [21] 王汉楚, 吴焕, 陈月. ADAM12联合多种肿瘤标志物检测在乳腺癌诊断中的价值分析[J]. 检验医学与临床, 2022, 19(7): 865-7. https://www.cnki.com.cn/Article/CJFDTOTAL-JYYL202207001.htm -

 点击查看大图
计量
- 文章访问数: 131
- HTML全文浏览量: 35
- PDF下载量: 11
- 被引次数: 0