


Application of histogram features based on multiscale multimodal magnetic resonance images for brain glioma grading
-
摘要:
目的 提出一种基于多尺度多模态磁共振图像的直方图特征,并采用机器学习的方法进行脑胶质瘤的分级应用。 方法 收集临床60例脑胶质瘤病例,其中Ⅱ级胶质瘤弥漫型星形细胞瘤和少突胶质细胞瘤22例,Ⅲ级胶质瘤间变型少突星形细胞瘤和间变星形细胞瘤18例,Ⅳ级胶质瘤胶质母细胞瘤例20例。病例图像信息包含平扫T2加权序列、T2加权压水压脂序列以及增强后的T1序列。对3种序列图像做多尺度化处理,对多尺度化后的图像做纹理分析,以病灶核心区域为感兴趣区,计算纹理参数,探究纹理参数与脑胶质瘤的内在关联含义,行Ⅱ级与Ⅲ级间纹理参数的ROC曲线分析,以及Ⅲ级与Ⅳ级间纹理参数的ROC曲线分析。以支持向量机作为机器学习核心,通过交叉验证法,得出本文纹理分析方法在不同级别胶质瘤的分级上的准确度和整体分级准确度。 结果 多尺度多模态磁共振图像直方图特征结合支持向量机模型的鉴别系统在Ⅱ级和Ⅲ级脑胶质瘤间总体参数准确率为91.5%,在Ⅲ级和Ⅳ级脑胶质瘤间的总体参数准确率为97.9%。整体的三分类支持向量机模型在交叉验证法的分级准确率为91.67%。 结论 多尺度多模态磁共振图像的直方图特征结合支持向量机模型的鉴别系统,可以在脑胶质瘤肿瘤分级上为临床提供重要信息。 Abstract:Objective To propose a histogram feature based on multi-scale multimodal magnetic resonance images and implementing a machine learning approach for the grading of gliomas. Methods sixty clinical cases of glioma were collected, including 22 cases of grade Ⅱ glioma (diffuse astrocytoma and oligodendroglioma), 18 cases of grade Ⅲ glioma (anaplastic oligoastrocytoma and anaplastic astrocytoma) and 20 cases of grade Ⅳ glioma (glioblastoma). Case image information included T2-weighted sequence, T2-weighted sequence with water pressured and fat pressured, contrast-enhanced T1-weighted sequence. Multi-scale processing was performed on the three sequence images, and texture analysis was performed on the multi-scaled images. Taking the core area of the lesion as the area of interest, the texture parameters were calculated, and the intrinsic correlation between the texture parameters and glioma was explored, ROC was used to analyze the texture parameters between grade Ⅱ and grade Ⅲ, also between grade Ⅲ and grade Ⅳ. Using the support vector machine learning, the accuracy of the texture analysis method in this paper in the grading of different grades of gliomas were obtained through the cross-validation method. Results The identification system of multi-scale and multi-modal magnetic resonance image histogram features combined with support vector machine model had an accuracy rate of 91.5% between grade Ⅱ and grade Ⅲ gliomas, and an accuracy rate of 97.9% between grade Ⅲ and grade Ⅳ gliomas. The classification accuracy rate of the overall three-category support vector machine model in the cross-validation method was 91.67%. Conclusion The histogram features of multi-scale and multi-modal magnetic resonance images combined with the identification system of support vector machine model can provide important identification information for clinical glioma tumor grade. -
Key words:
- texture analysis /
- multi-scale /
- glioma /
- histogram features /
- machine learning /
- support vector machine
-

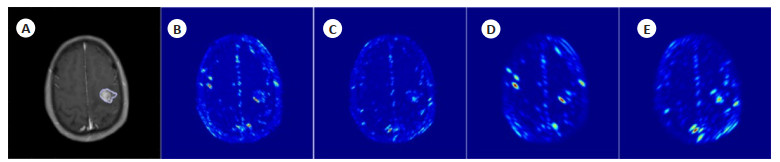
图 1 脑胶质瘤T1增强图像(A)及经过波长尺度为2、3、4、5的滤波后图像(B~E)
Figure 1. T1-enhanced image of glioma (A) and images filtered by wavelength scales of 2, 3, 4 and 5 (B-E).

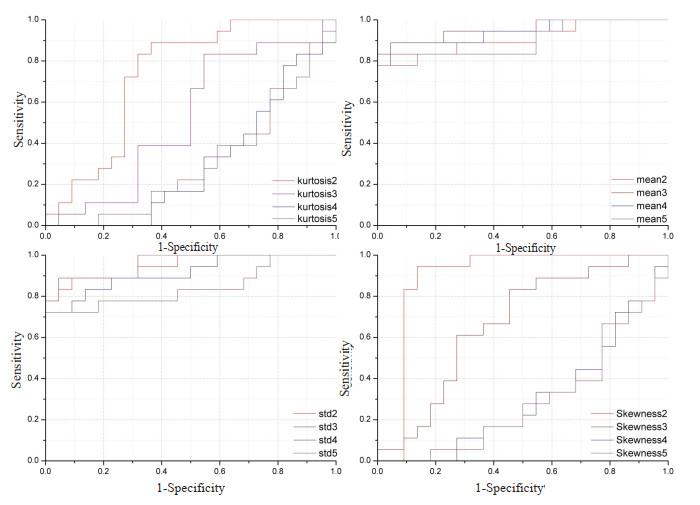
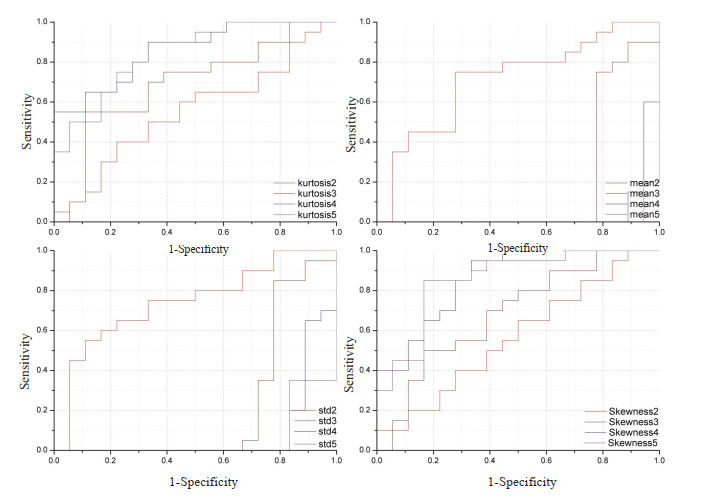
图 2 T1加权增强序列图像峰度(A)、均值(B)、方差(C)、偏度(D)在Ⅱ级与Ⅲ级脑胶质瘤上的ROC分析图
Figure 2. ROC analysis plots of kurtosis (A), mean (B), standard deviation (C) and skewness (D) of T1-weighted enhanced sequence images on grade Ⅱ versus grade Ⅲ glioma. 2, 3, 4, and 5 represent window width scales of 2, 3, 4, and 5 pixel points for Gabor filtering.

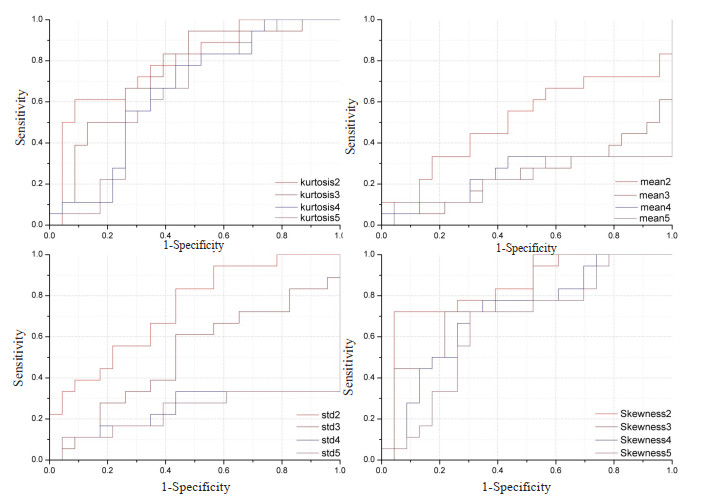
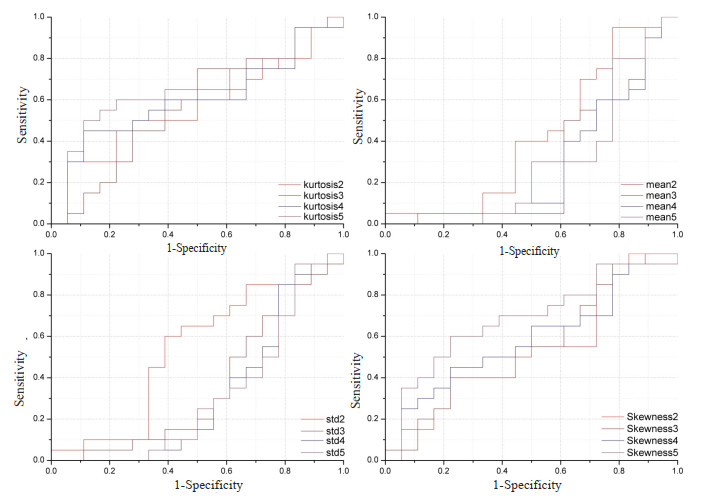
图 3 T2序列图像峰度(A)、均值(B)、方差(C)、偏度(D)在Ⅱ级与Ⅲ级脑胶质瘤上的ROC分析图
Figure 3. ROC analysis plots of kurtosis (A), mean (B), standard deviation (C) and skewness (D) of T2 sequence images on grade Ⅱ versus grade Ⅲ glioma. 2, 3, 4 and 5 represent window width scales of 2, 3, 4 and 5 pixel points for Gabor filtering.

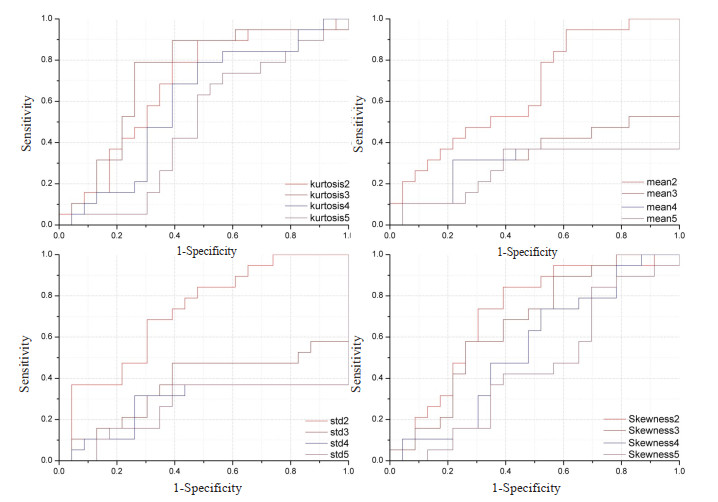
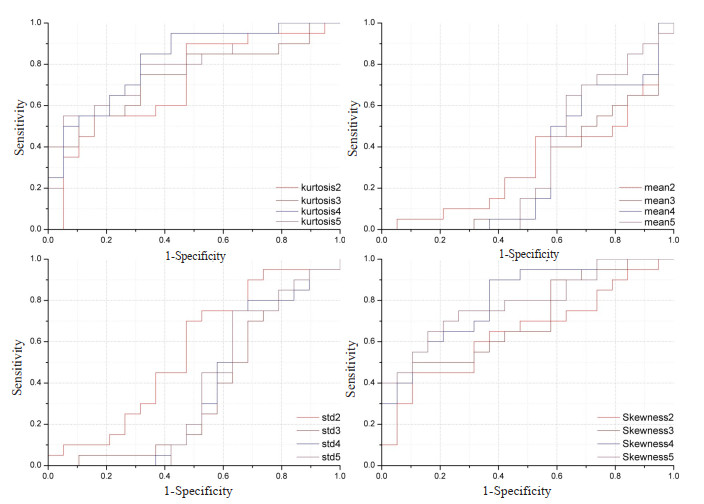
图 4 T2_flair序列图像峰度(A)、均值(B)、方差(C)、偏度(D)在Ⅱ级与Ⅲ级脑胶质瘤上的ROC分析图
Figure 4. ROC analysis plots of T2_flair sequence image kurtosis (A), mean (B), standard deviation (C) and skewness (D) on grade Ⅱ versus grade Ⅲ glioma. 2, 3, 4 and 5 represent the Gabor filtered wavelength scale of 2, 3, 4 and 5 pixel points.

图 5 T1加权增强序列图像峰度(A)、均值(B)、方差(C)、偏度(D)在Ⅲ级与Ⅳ级脑胶质瘤上的ROC分析图
Figure 5. ROC analysis plots of kurtosis (A), mean (B), standard deviation (C) and skewness (D) of T1-weighted enhanced sequence images on grade Ⅲ versus grade Ⅳ gliomas. 2, 3, 4 and 5 represent window width scales of 2, 3, 4 and 5 pixel points for Gabor filtering.

图 6 T2序列图像峰度(A)、均值(B)、方差(C)、偏度(D)在Ⅲ级与Ⅳ级脑胶质瘤上的ROC分析图
Figure 6. ROC analysis plots of T2 sequence image kurtosis (A), mean (B), standard deviation (C) and skewness (D) on grade Ⅲ versus grade Ⅳ glioma. 2, 3, 4 and 5 represent the Gabor filter with a window width scale of 2, 3, 4 and 5 pixel points.

图 7 T2_flair序列图像峰度(A)、均值(B)、方差(C)、偏度(D)在Ⅲ级与Ⅳ级脑胶质瘤上的ROC分析图
Figure 7. ROC analysis plots of T2_flair sequence image kurtosis (A), mean (B), standard deviation (C) and skewness (D) on grade Ⅲ versus grade Ⅳ glioma. 2, 3, 4 and 5 represent the Gabor filter with a window width scale of 2, 3, 4 and 5 pixel points.
表 1 用于纹理分析的4种直方图特征参数的计算公式
Table 1. Formulas for the four histogram feature parameters used for texture analysis.
Textural Features Calculation formula Kurtosis $ P_{ {kur }}=\frac{1}{N-1} \sum\nolimits_{i=1}^N \frac{\left(p_i-p_{ {mean }}\right)^4}{p_{ {std }}{ }^4}$ Mean $P_{ {mean }}=\frac{\sum\nolimits_{i=1}^N P i}{N} $ Standard deviation $P_{ {std }}=\sqrt{\frac{\sum\nolimits_{i=1}^N\left(P_j-P_{ {mean }}\right)}{N-1}} $ Skewness $P_{ {ste }}=\frac{1}{N-1} \sum\limits_{i=1}^N \frac{\left(p_i-p_{ {mean }}\right)^3}{p_{ {std }}{ }^3} $  下载: 导出CSV
表 2 Ⅱ级与Ⅲ级脑胶质瘤间纹理参数的ROC曲线下面积参数结果
Table 2. AUC (area under the curve) parameter results of ROC analysis of texture parameters between grade Ⅱ and Ⅲ glioma
Ⅱ/Ⅲ T1WI-CE T2WI T2WI-f AUC P AUC P AUC P Mean2 0.51208 0.8955 0.51208 0.8955 0.65904 0.07904 Std2 0.73913 0.0093 0.73913 0.0093 0.72311 0.01374 Kurtosis2 0.84058 0.00021 0.84058 0.00021 0.71625 0.01694 Skewenss2 0.79227 0.00148 0.79227 0.07214 0.6865 0.03944 Mean3 0.25362 0.00737 0.25362 0.00737 0.32037 0.04728 Std3 0.50966 0.91631 0.50966 0.91631 0.37529 0.16844 Kurtosis3 0.78502 0.00194 0.78502 0.00194 0.66133 0.07482 Skewness3 0.75121 0.00629 0.75121 0.00629 0.72769 0.01192 Mean4 0.24638 0.00581 0.24638 0.00581 0.29519 0.02371 Std4 0.25121 0.00681 0.25121 0.00681 0.28375 0.01694 Kurtosis4 0.71739 0.01806 0.71739 0.01806 0.54691 0.60443 Skewness4 0.65459 0.0927 0.65459 0.0927 0.59497 0.2943 Mean5 0.22947 0.00326 0.22947 0.00326 0.2746 0.0128 Std5 0.23913 0.00455 0.23913 0.00455 0.26773 0.01032 Kurtosis5 0.657 0.08772 0.657 0.08772 0.45309 0.60443 Skewness5 0.64251 0.12115 0.64251 0.12115 0.48741 0.88946 The markings 2, 3, 4 and 5 after the parameters in the table represent filter scales of 2, 3, 4 and 5 voxel units.
下载: 导出CSV
表 3 Ⅲ级与Ⅳ级脑胶质瘤间纹理参数的ROC曲线下面积参数结果
Table 3. AUC parameter results of ROC analysis of texture parameters between grade Ⅲ and Ⅳ glioma
Ⅲ/Ⅳ T1WI-CE T2WI T2WI-f AUC P AUC P AUC P Mean2 0.71389 0.02438 0.425 0.42991 0.32368 0.05976 Std2 0.74167 0.01098 0.53889 0.68232 0.55526 0.55516 Kurtosis2 0.56667 0.4829 0.55278 0.57857 0.65 0.10925 Skewness2 0.55278 0.57857 0.56389 0.50132 0.71316 0.02285 Mean3 0.18611 9.545E-4 0.29722 0.03283 0.26842 0.01341 Std3 0.22222 0.00346 0.35278 0.12127 0.35789 0.1292 Kurtosis3 0.68611 0.05014 0.55278 0.57857 0.71053 0.02459 Skewness3 0.69167 0.04367 0.57222 0.44718 0.74737 0.00826 Mean4 0.04167 < 0.00001 0.27778 0.01934 0.31053 0.04307 Std4 0.08611 0.00001 0.31944 0.05739 0.37105 0.16858 Kurtosis4 0.85833 0.00016 0.58056 0.39654 0.81053 0.00091 Skewness4 0.85833 0.00016 0.6 0.29258 0.81842 0.00067 Mean5 0.01111 < 0.00001 0.29722 0.03283 0.33421 0.0767 Std5 0.05833 < 0.00001 0.31389 0.05014 0.37368 0.17744 Kurtosis5 0.85556 0.00018 0.68333 0.05367 0.78947 0.002 Skewness5 0.84167 0.00032 0.65278 0.10785 0.78421 0.00241 The markings 2, 3, 4 and 5 after the parameters in the table represent filter scales of 2, 3, 4 and 5 voxel units.
下载: 导出CSV
-
[1] 周晶, 白岩, 马玲, 等. MRI影像组学在脑胶质瘤分级中的价值研究[J]. 中国微侵袭神经外科杂志, 2018, 23(6): 244-8. https://www.cnki.com.cn/Article/CJFDTOTAL-ZWQX201806003.htm [2] 吴劲松, 毛颖. 脑胶质瘤手术理念和研究热点[J]. 中国神经精神疾病杂志, 2009, 35(6): 376-9. https://www.cnki.com.cn/Article/CJFDTOTAL-ZSJJ200906021.htm [3] Rathore S, Niazi T, Iftikhar MA, et al. Glioma grading via analysis of digital pathology images using machine learning[J]. Cancers, 2020, 12(3): 578. doi: 10.3390/cancers12030578 [4] Chaddad A, Kucharczyk MJ, Daniel P, et al. Radiomics in glioblastoma: current status and challenges facing clinical implementation[J]. Front Oncol, 2019, 9: 374. doi: 10.3389/fonc.2019.00374 [5] 刘震昊, 白旭, 叶慧义, 等. 基于T2WI的纹理分析和机器学习在鉴别肾乏脂血管平滑肌脂肪瘤和肾癌中的价值[J]. 磁共振成像, 2021, 12(2): 38-42. https://www.cnki.com.cn/Article/CJFDTOTAL-CGZC202102009.htm [6] 邓达标, 毛家骥, 汪文胜, 等. 基于3D动脉自旋标记成像的纹理分析法在脑胶质瘤分级中的初步研究[J]. 磁共振成像, 2019, 10(5): 321-6. https://www.cnki.com.cn/Article/CJFDTOTAL-CGZC201905003.htm [7] 曹明明, 刘树学. MR增强图像纹理分析技术预测肝癌介入治疗预后的价值[J]. 现代消化及介入诊疗, 2020, 25(4): 533-6. https://www.cnki.com.cn/Article/CJFDTOTAL-XDXH202004028.htm [8] 苏春秋, 韩秋月, 周茂冬, 等. 动态对比增强MRI纹理分析法与磁敏感加权成像联合应用在脑胶质瘤分级中的价值[J]. 临床放射学杂志, 2018, 37(8): 1264-8. https://www.cnki.com.cn/Article/CJFDTOTAL-LCFS201808006.htm [9] 张刚, 马宗民. 一种采用Gabor小波的纹理特征提取方法[J]. 中国图象图形学报A, 2010, 15(2): 247-54. https://www.cnki.com.cn/Article/CJFDTOTAL-ZGTB201002012.htm [10] Roberti de Siqueira F, Robson Schwartz W, Pedrini H. Multi-scale gray level co-occurrence matrices for texture description[J]. Neurocomputing, 2013, 120: 336-45. [11] 哈热勒哈什·安曼太, 巴图尔·吐尔地. 磁敏感加权成像在脑胶质瘤鉴别诊断、术前病理分级及术中的应用[J]. 分子影像学杂志, 2022, 45(6): 891-6. doi: 10.12122/j.issn.1674-4500.2022.06.19 [12] 梅东东, 罗燕, 龚静山, 等. 基于全肿瘤ADC图纹理特征诊断脑胶质瘤分级[J]. 中国医学影像技术, 2019, 35(7): 976-80. https://www.cnki.com.cn/Article/CJFDTOTAL-ZYXX201907004.htm [13] 刘小华, 赵华硕, 何鹏, 等. 基于支持向量机的MRI灌注与扩散技术对脑胶质瘤术前分级预测模型研究[J]. 临床放射学杂志, 2022, 41(2): 224-30. https://www.cnki.com.cn/Article/CJFDTOTAL-LCFS202202004.htm [14] Louis DN, Perry A, Reifenberger G, et al. The 2016 World Health Organization classification of tumors of the central nervous system: a summary[J]. Acta Neuropathol, 2016, 131(6): 803-20. [15] Thomas JV, Abou Elkassem AM, Ganeshan B, et al. MR imaging texture analysis in the abdomen and pelvis[J]. Magn Reson Imaging Clin N Am, 2020, 28(3): 447-56. [16] 张雨柔, 华一凡, 朱心雨, 等. 基于MRI的纹理分析在高级别胶质瘤中的应用进展[J]. 磁共振成像, 2023, 14(2): 174-8. https://www.cnki.com.cn/Article/CJFDTOTAL-CGZC202302031.htm [17] 南海燕, 杨洋, 颜林枫, 等. 基于DCE图像优化胶质瘤自动分级纹理模型[J]. 磁共振成像, 2018, 9(10): 737-41. https://www.cnki.com.cn/Article/CJFDTOTAL-CGZC201810007.htm [18] 韩秋月, 武江芬, 鲁珊珊, 等. DCE-MRI直方图分析在脑胶质瘤分级中的应用[J]. 中国医学计算机成像杂志, 2017, 23(1): 7-12. https://www.cnki.com.cn/Article/CJFDTOTAL-YJTY201701002.htm [19] 郝惠惠, 吴亚平, 赵国桦, 等. 基于多视角的脑胶质瘤分级模型研究[J]. 计算机应用与软件, 2021, 38(7): 35-40. https://www.cnki.com.cn/Article/CJFDTOTAL-JYRJ202107009.htm [20] 杨晓莹, 朱远, 张敏, 等. 垂体腺瘤质地与MRI图像的纹理分析比较[J]. 临床放射学杂志, 2019, 38(4): 613-7. https://www.cnki.com.cn/Article/CJFDTOTAL-LCFS201904011.htm [21] Ortiz-Ramón R, Ruiz-España S, Mollá-Olmos E, et al. Glioblastomas and brain metastases differentiation following an MRI texture analysis-based radiomics approach[J]. Phys Med, 2020, 76: 44-54. [22] Fetit AE, Novak J, Peet AC, et al. Three-dimensional textural features of conventional MRI improve diagnostic classification of childhood brain tumours[J]. NMR Biomed, 2015, 28(9): 1174-84. [23] Chaddad A, Desrosiers C, Toews M. Multi-scale radiomic analysis of sub-cortical regions in MRI related to autism, gender and age[J]. Sci Rep, 2017, 7: 45639. https://www.nature.com/articles/srep45639 -

 点击查看大图
计量
- 文章访问数: 104
- HTML全文浏览量: 74
- PDF下载量: 5
- 被引次数: 0