


Preliminary application value of spectral CT and radiomics analysis from iodine overlay maps nomogram in prediction of the type of epithelial ovarian cancer
-
摘要:
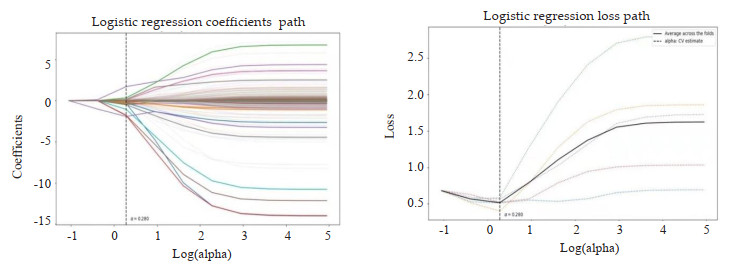
目的 探讨联合碘基图影像组学模型、能谱CT多参数及临床危险因素构建的诺模图在预测上皮性卵巢癌(EOC)分型中的价值。 方法 回顾性分析122例(Ⅰ型46例,Ⅱ型76例)行能谱CT增强扫描并经病理证实为EOC的患者,结合血清糖类抗原125及人附睾蛋白4,建立临床模型;比较感兴趣区在静脉期图像下的碘浓度(IC)、标准化碘浓度(NIC)、能谱曲线斜率(λ)、有效原子序数(Zeff)及标准化有效原子序数(NZeff),通过Logstic回归分析筛选出有统计学意义的能谱参数,建立能谱CT参数模型;于动静脉期碘基图提取影像组学特征,按照7:3的比例建立训练组(n=85)和验证组(n=37),经过数据降维处理,筛选出有效的特征,建立影像组学模型;采用ROC曲线及曲线下面积(AUC)评价模型的诊断效能并利用模型构建诺模图,使用决策曲线分析及校正曲线评价诺模图的临床应用价值。 结果 两组患者血清糖类抗原125及人附睾蛋白4差异有统计学意义(P < 0.05),将两者联合建立临床模型,训练组AUC为0.797(95% CI: 0.700~0.895),验证组AUC为0.776(95% CI: 0.620~0.933);λ40~70 keV、λ40~100 keV、IC、NIC、Zeff、NZeff的差异有统计学意义(P < 0.05),二元Logstic回归分析提示NIC为独立影响因素(P=0.008),训练组AUC为0.813(95% CI: 0.723~0.902),验证组AUC为0.837(95% CI: 0.707~0.966);影像组学经降维后共筛选出18个影像组学特征,其中包括6个一阶特征、8个灰度特征、1个形态特征、3个小波特征。训练组AUC为0.825(95% CI: 0.733~0.917),验证组AUC为0.851(95% CI: 0.725~0.796)。联合模型的诊断效能最高,训练组AUC为0.935(95% CI: 0.885~0.986),验证组AUC为0.938(95% CI: 0.865~1.000),均高于单一模型。 结论 临床-能谱-影像组学诺模图在预测上皮性卵巢癌的分型方面具有潜在的价值。 Abstract:Objective To explore the value of nomogram combined with radiomics analysis from iodine overlay maps, spectral CT and clinical features in prediction of the type of epithelial ovarian cancer. Methods We retrospectively analyzed 122 patients (including 46 patients of typeⅠ and 76 patients of typeⅡ) with epithelial ovarian cancer pathologically confirmed underwent contrast enhanced spectral CT scan. The clinical characteristic model were constructed combined with serum CA125 and HE4. Iodine concentration (IC), normalized iodine concentration (NIC), slope of spectrum energy curve (λ), effective-Z (Zeff), normalized effective-Z (NZeff) of the region of interest under the venous phase image were compared. The significant energy spectrum parameters were selected by Logistic regression analysis, and then constructed the energy spectrum CT parameters model. Radiomics features were extracted from iodine overlay maps in the arteriovenous phase. Patients were randomized devided into training group (n=85) and test group (n=37) set in a ratio of 7:3. After dimensionality reduction of the data set, effective features were screened out and then construct the radiomics model. The diagnostic efficiency of the models were evaluated by using the ROC curve and the area under the curve (AUC). The clinical application value of normograph was evaluated by using the decision curve analysis and correction curve. Results Serum CA125 and HE4 were significantly different between two groups. A clinical model was established by combining the two methods, and the areas under the curve were respectively 0.797(95% CI: 0.700-0.895) for the training group 0.776(95% CI: 0.620-0.933) for the test group. λ40-70 keV, λ40-100 keV, IC, NIC, Zeff, NZeff were significantly different (P < 0.05). Binary Logistic regression analysis suggested that NIC was an independent factor (P=0.008). The AUC of NIC was 0.813(95% CI: 0.723-0.902) for the training group and 0.837(95% CI: 0.707-0.966) for the test group. Eighteen features were screened by imaging omics, including six first-order features, eight gray-scale features, one shape features and three wavelet features. The AUC was 0.825(95% CI: 0.733-0.917) for the training group and 0.851(95% CI: 0.725-0.796) for the test group. The diagnostic efficiency of the combined model was higher than of the single model. The AUC was 0.935(95% CI: 0.885-0.986) for the training group and 0.938(95% CI: 0.865-1.000) for the test group. Conclusion Clinic-spectral CT-radiomics nomogram have potential value in predicting the typing of epithelial ovarian cancer. -
Key words:
- epithelial ovarian cancer /
- radiomics /
- spectral CT /
- nomogram
-

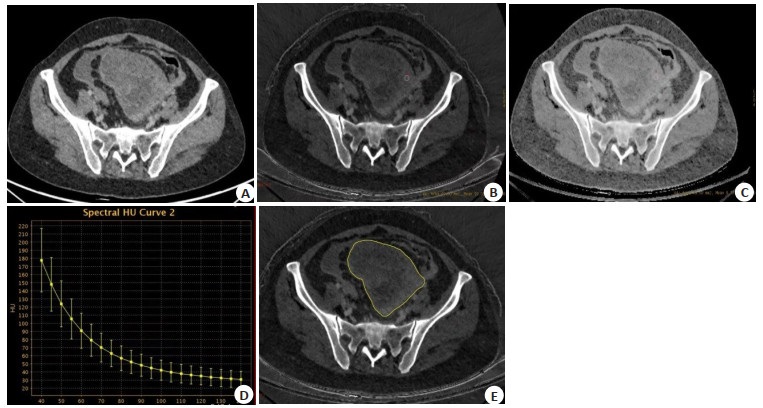
图 1 典型病例图像
Figure 1. Typical case images. A: Initial diagram; B: Iodine overlay maps; C: Effective-Z; D: Slope of spectrum energy curve; E: ROI was delineated along the edge of the lesion at the maximum level of the patient's tumor.

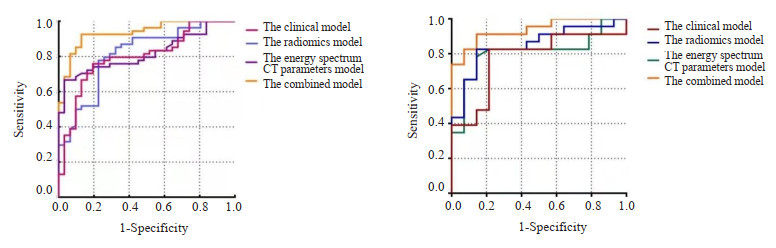
图 3 不同模型在训练组和验证组中的受试者工作特征曲线
Figure 3. ROC of different models in training group and test group. A: Training group; B: Test group.

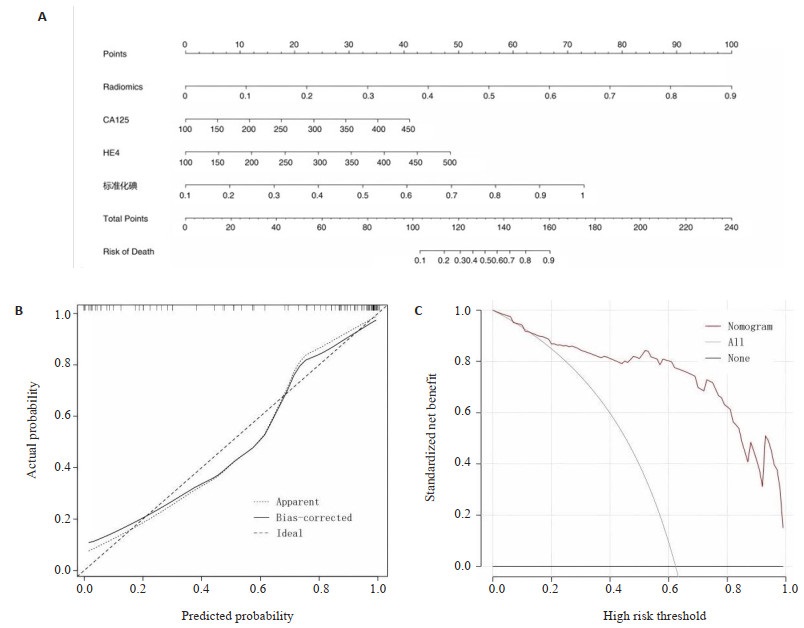
图 4 联合模型列线图及模型评估
Figure 4. The combined model and evaluation. A: Nomogram; B: Calibration curve of nomogram model; C: Decision curve analysis nomogram model.
B =1000 repetitions, boot Mean absolute error =0.034, n=85
表 1 训练组及验证组肿瘤标记物及能谱参数比较
Table 1. Comparison of tumor marker and energy spectrum parameters between training group and test group (Mean±SD)
Parameter Training group (n=85) Test group (n=37) Type Ⅰ Type Ⅱ t/Z P Type Ⅰ Type Ⅱ t/Z P CA125 202.09±73.49 258.45±81.95 -3.278 0.020 228.33±40.64 271.84±71.45 -2.076 0.024 HE4 245.97±48.67 323.62±106.17 -3.891 0.020 243.77±53.79 291.36±81.00 -1.947 0.039 λ40-70 keV 2.98±1.08 3.62±0.97 -2.781 0.009 2.71±0.87 3.49±0.99 -2.476 0.020 λ70-100 keV 0.74±0.31 0.98±0.33 -3.347 0.003 0.74±0.29 0.92±0.28 -1.845 0.071 λ40-100 keV 1.86±0.67 2.30±0.57 -3.113 0.004 1.72±0.55 2.20±0.62 -2.403 0.023 IC (mg/mL) 16.97±4.44 21.01±6.71 -3.163 0.001 16.14±4.68 21.51±7.98 -1.742 0.009 NIC 0.39±0.14 0.61±0.19 -6.040 < 0.001 0.35±0.11 0.57±0.17 -4.170 < 0.001 Zeff[M(P25, P75)] 8.54(8.35, 8.80) 8.81(8.58, 9.03) -3.251 < 0.001 8.53(8.29, 8.80) 8.69(8.56, 9.11) -2.380 0.013 NZeff[M(P25, P75)] 0.89(0.86, 0.92) 0.94(0.89, 0.97) -3.760 < 0.001 0.85(0.78, 0.90) 0.93(0.86, 0.96) -2.610 0.005 CA125: Carbohydrate antigen 125; HE4: Human epididymis protein 4; λ: Slope of the energy spectrum curve; IC: Iodine concentration; NIC: Normalized iodine concentration; Zeff: Effective-Z; NZeff: Normalized effective-Z.  下载: 导出CSV
表 2 不同模型在训练组和验证组中的AUC、95% CI、敏感度及特异性
Table 2. AUC, 95% CI, sensitivity and specificity of different models in training group and test group
Model Training group (n=85) Test group (n=37) AUC(95% CI) Sensitivity specificity AUC(95% CI) Sensitivity Specificity Clinical characteristic model 0.797(95% CI: 0.700-0.895) 0.759 0.806 0.776(95% CI: 0.620-0.933) 0.826 0.786 Energy spectrum CT parameters model 0.813(95% CI: 0.723-0.902) 0.667 0.968 0.837(95% CI: 0.707-0.966) 0.783 0.857 Radiomics model 0.825(95% CI: 0.733-0.917) 0.778 0.774 0.851(95% CI: 0.725-0.796) 0.826 0.857 Combined model 0.935(95% CI: 0.885-0.986) 0.926 0.871 0.938(95% CI: 0.865-1.000) 0.913 0.857
下载: 导出CSV
-
[1] Lowe KA, Chia VM, Taylor A, et al. An international assessment of ovarian cancer incidence and mortality[J]. Gynecol Oncol, 2013, 130(1): 107-14. doi: 10.1016/j.ygyno.2013.03.026 [2] Kurman RJ, Shih IM. The dualistic model of ovarian carcinogenesis: revisited, revised, and expanded[J]. Am J Pathol, 2016, 186(4): 733-47. doi: 10.1016/j.ajpath.2015.11.011 [3] 马丽颖, 孙美玉. MRI对上皮性卵巢癌组织学分型的诊断应用[J]. 国际医学放射学杂志, 2022, 45(1): 89-93. https://www.cnki.com.cn/Article/CJFDTOTAL-GWLC202201018.htm [4] Lee SH, Park H, Ko ES. Radiomics in breast imaging from techniques to clinical applications: a review[J]. Korean J Radiol, 2020, 21(7): 779-92. doi: 10.3348/kjr.2019.0855 [5] Henschke CI. Dual-energy computed tomography for pre-surgical identification of adenocarcinoma subtypes[J]. Transl Lung Cancer Res, 2020, 9(3): 432-3. doi: 10.21037/tlcr.2020.03.18 [6] 钱洛丹, 吴慧, 牛广明, 等. 传统影像特征与多序列影像组学模型对上皮性卵巢癌分型的价值[J]. 放射学实践, 2021, 36(5): 621-7. https://www.cnki.com.cn/Article/CJFDTOTAL-FSXS202105019.htm [7] Liu D, Zhang L, Indima N, et al. CT and MRI findings of type Ⅰ and type Ⅱ epithelial ovarian cancer[J]. Eur J Radiol, 2017, 90: 225-33. doi: 10.1016/j.ejrad.2017.02.017 [8] 简俊明. 面向医学图像的机器学习方法研究及在卵巢癌精准诊断中的应用[D]. 合肥: 中国科学技术大学, 2021. [9] 于媛媛, 科徐曼, 王凤丽. 经阴道彩色多普勒超声联合血清HE4和CA125及TSGF对卵巢癌的诊断价值[J]. 中国卫生工程学, 2022, 21(6): 981-3, 986. https://www.cnki.com.cn/Article/CJFDTOTAL-ZGWX202206031.htm [10] Aslan K, Onan MA, Yilmaz C, et al. Comparison of HE 4, CA 125, ROMA score and ultrasound score in the differential diagnosis of ovarian masses[J]. J Gynecol Obstet Hum Reprod, 2020, 49(5): 101713. doi: 10.1016/j.jogoh.2020.101713 [11] 林林, 鞠明秀, 乔志伟, 等. HE4、CA125与ROMA模型联合检测诊断卵巢上皮性癌价值研究[J]. 中国实用妇科与产科杂志, 2019, 35(12): 1384-7. https://www.cnki.com.cn/Article/CJFDTOTAL-ZGSF201912025.htm [12] 李梅芬, 何燕莲, 舒婷. 超声联合血清HE4、D-二聚体检测对卵巢癌诊断价值[J]. 分子影像学杂志, 2021, 44(1): 179-83. doi: 10.12122/j.issn.1674-4500.2021.01.37 [13] 王帅, 程锦. CT、阴道超声对卵巢良恶性肿瘤的诊断效能及与肿瘤标志物相关性分析[J]. 影像科学与光化学, 2021, 39(3): 450-4. https://www.cnki.com.cn/Article/CJFDTOTAL-GKGH202103022.htm [14] Sananmuang T, Agarwal M, Maleki F, et al. Dual energy computed tomography in head and neck imaging: pushing the envelope[J]. Neuroimaging Clin N Am, 2020, 30(3): 311-23. [15] Chae EJ, Song JW, Seo JB, et al. Clinical utility of dual-energy CT in the evaluation of solitary pulmonary nodules: initial experience[J]. Radiology, 2008, 249(2): 671-81. [16] 齐铮琴, 赵锦, 李扬. 经阴道超声三维血管定量与病理微血管密度对卵巢癌临床分期及病理类型的应用价值[J]. 中国临床医学影像杂志, 2010, 21(7): 521-2. https://www.cnki.com.cn/Article/CJFDTOTAL-LYYX201007029.htm [17] Lin JZ, Zhang L, Zhang CY, et al. Application of gemstone spectral computed tomography imaging in the characterization of solitary pulmonary nodules: preliminary result[J]. J Comput Assist Tomogr, 2016, 40(6): 907-11. [18] 韩引萍, 薛彩强, 刘显旺, 等. 能谱CT参数在膀胱尿路上皮癌术前病理分级预测中的价值[J]. 放射学实践, 2023, 38(1): 65-9. https://www.cnki.com.cn/Article/CJFDTOTAL-FSXS202301013.htm [19] Kim C, Kim W, Park SJ, et al. Application of dual-energy spectral computed tomography to thoracic oncology imaging[J]. Korean J Radiol, 2020, 21(7): 838-50. [20] Yan L, Chai N, Bao YZ, et al. Enhanced computed tomography-based radiomics signature combined with clinical features in evaluating nuclear grading of renal clear cell carcinoma[J]. J Comput Assist Tomogr, 2020, 44(5): 730-6. [21] 李诗韵. 基于CT平扫的2D与3D影像组学模型对卵巢良恶性病变的鉴别诊断价值初探[D]. 南昌: 南昌大学, 2021. [22] Li JJ, Li XB, Ma JW, et al. Computed tomography-based radiomics machine learning classifiers to differentiate type Ⅰ and type Ⅱ epithelial ovarian cancers[J]. Eur Radiol, 2022, 23(7): 1-12. [23] Qian LD, Ren JL, Liu AS, et al. MR imaging of epithelial ovarian cancer: a combined model to predict histologic subtypes[J]. Eur Radiol, 2020, 30(11): 5815-25. [24] 徐一铭, 袁梅, 邱琳, 等. 能谱CT及碘基图影像组学特征鉴别肺炎性及恶性病变[J]. 南京医科大学学报: 自然科学版, 2021, 41(7): 1063-8. https://www.cnki.com.cn/Article/CJFDTOTAL-NJYK202107021.htm -

 点击查看大图
计量
- 文章访问数: 103
- HTML全文浏览量: 38
- PDF下载量: 13
- 被引次数: 0