


Diagnostic value of C-TIRADS combined with acoustic radiation force pulse imaging technology for thyroid papillary carcinoma in C-TIRADS grade 3-5 nodules
-
摘要:
目的 探讨C-TIRADS分类联合声辐射力脉冲成像技术中的声触诊组织成像(VTI)及声触诊组织量化成像(VTIQ)在CTIRADS3~5类甲状腺结节中鉴别诊断甲状腺乳头状癌的应用价值。 方法 选取于我院就诊并分类为C-TIRADS3-5类的甲状腺结节患者194例共201个结节, 进行VTIQ及VTI检查, 获取病灶剪切波速度平均值及VTI图像。以病理学为金标准构建ROC曲线, 计算曲线下面积, 获取各诊断方法的最佳诊断界值, 分析3组单独诊断及C-TIRADS+VTI、C-TIRADS+VTIQ二者联合诊断组的诊断效能; 构建C-TIRADS联合VTIQ及VTI的二元Logistic回归预测模型, 计算并分析三者联合诊断组的诊断效能, 采用Z检验比较各组曲线下面积。 结果 经明确的细胞病理及组织病理学证实良性结节81枚, 恶性结节120枚; C-TIRADS分类与甲状腺结节恶性率呈较强正相关关系(r=0.624, P < 0.01);与单独应用C-TIRADS (0.806)相比, C-TIRADS+VTI组、CTIRADS+VTIQ组及C-TIRADS+VTI+VTIQ组的曲线下面积均有一定升高, 且三者联合组升高最为明显(0.908), 差异均有统计学意义(P < 0.05), 三者联合诊断与病理的一致性Kappa值较C-TIRADS单独应用上升; 单独应用C-TIRADS诊断甲状腺良恶性结节的敏感度、特异性、准确率分别为90.0%、70.4%、82.0%;C-TIRADS+VTIQ+VTI三者联合预测模型组诊断甲状腺良恶性结节的敏感度、特异性、准确率分别为91.7%、80.2%、86.1%, 诊断恶性结节的准确率为89.2%。 结论 声辐射力脉冲技术中的VTI和VTIQ增强了C-TIRADS对甲状腺结节的诊断性能, 声辐射力脉冲技术可作为常规超声的补充, 以非侵入性的方式提高对分类为3~5类的结节中甲状腺乳头状癌鉴别的能力。 -
关键词:
- 中国甲状腺影像报告和数据系统 /
- 声辐射力脉冲成像 /
- 甲状腺结节 /
- 诊断效能
Abstract:Objective To explore the application value of acoustic palpation tissue imaging (VTI) and acoustic palpation tissue quantitative imaging (VTIQ) in C-TIRADS classification combined with acoustic radiation force pulse imaging technology in differential diagnosis of thyroid papillary carcinoma in C-TIRADS 3-5 thyroid nodules. Methods A total of 194 patients with thyroid nodules classified as C-TIRADS 3-5 in our hospital with 201 nodules were selected for VTIQ and VTI examination to obtain the average value of shear wave velocity and VTI image of the lesions.The ROC curve of the subjects was constructed based on the gold standard of pathology, and AUC was calculated to obtain the best diagnostic threshold of each diagnostic method.The diagnostic efficacy of three groups of independent diagnosis and C-TIRADS+VTI and C-TIRADS+VTIQ combined diagnosis were analyzed.The binary Logistic regression prediction model of C-TIRADS combined with VTIQ and VTI was constructed.The diagnostic efficacy of the three combined diagnostic groups was calculated and analyzed.The AUCs under the curve of each group were compared by Z-test. Results Eighty-one benign nodules and 120 malignant nodules were confirmed by clear cytopathology and histopathology.C-TIRADS grade was positively correlated with the malignant rate of thyroid nodules (r=0.624, P < 0.01).Compared with the application of C-TIRADS alone (0.806), the AUC of C-TIRADS VTI group, C-TIRADS VTIQ group and C-TIRADS VTI VTIQ group increased to a certain extent, and the combination of the three groups increased the most significantly (0.908), the difference was statistically significant (P < 0.05).The kappa value of the consistency between the three combined diagnosis and pathology was higher than that of C-TIRADS alone.The sensitivity, specificity and accuracy of C-TIRADS alone in the diagnosis of benign and malignant thyroid nodules were 90.0%, 70.4% and 82.0%, respectively.The sensitivity, specificity and accuracy of C-TIRADS VTIQ VTI combined prediction model group in diagnosis of benign and malignant thyroid nodules were 91.7%, 80.2% and 86.1%, respectively, and the accuracy of diagnosis of malignant thyroid nodules was 89.2%. Conclusion The VTI and VTIQ in acoustic radiation force pulse technology enhance the diagnostic performance of C-TIRADS for benign and malignant thyroid nodules.Acoustic radiation force pulse technology can be used as a supplement to conventional ultrasound to improve the ability to differentiate thyroid papillary carcinoma in nodules classified as 3-5 in a non-invasive way. -

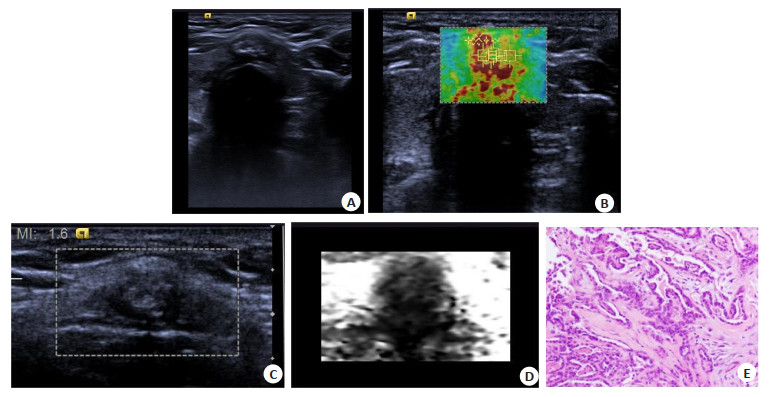
图 1 患者女,56岁,甲状腺峡部低回声结节,伴钙化,C-TIRADS分类4C类(3分)
A: 二维超声声像图; B: VTIQ速度模式图, SWVmean为6.95 m/s; C~D: VTI显示结节VTI分级以黑色为主, 伴少许白色, 评分为V级, 并可见黑色部分面积呈纵向, 大于二维声像图结节面积; E: 病检结果示甲状峡部乳头状癌(HE染色, ×100).
Figure 1. A 56-year-old female patient, hypoechoic nodule in the thyroid isthmus with calcification, C-TIRADS 4C.

图 2 C-TIRADS分类、C-TIRADS+VTI、C-TIRADS+VTIQ及三者联合诊断201个甲状腺结节的ROC曲线
Figure 2. ROC curve of 201 thyroid nodules diagnosed by C-TIRADS classification, C-TIRADS VTI, C-TIRADS VTIQ and their combination.
表 1 C-TIRADS各分类结果与恶性率对比
Table 1. Comparison of C-TIRADS classification results and malignant rate
分层系统 分类 良性结节(n) 恶性结节(n) 总计(n) 实际恶性率(%) 理论恶性率(%) C-TIRADS 3 9 0 9 0 < 2 4A 48 12 60 20.0 2~10 4B 12 58 70 82.8 10~50 4C 12 45 57 78.9 50~90 5 0 5 5 100 > 90 C-TIRADS: 中国甲状腺影像报告和数据系统.  下载: 导出CSV
表 2 各诊断方法单独应用对甲状腺结节的诊断效能
Table 2. Diagnostic efficacy of various diagnostic methods applied separately for thyroid nodules
诊断方法 AUC(95% CI) Cut-off值 敏感度(%) 特异性(%) 准确度(%) PPV(%) NPV(%) C-TIRADS 0.806(0.744~0.863) 4B 90.0 70.4 82.0 81.8 82.6 VTI组 0.813(0.752~0.865) Ⅳ级 80.8 76.5 62.7 61.9 75.0 VTIQ 0.829(0.770~0.878) 3.412 m/s 65.8 88.9 75.6 64.3 89.9 VTI: 声触诊组织成像; VTIQ: 声触诊组织成像量化.
下载: 导出CSV
表 3 C-TIRADS、VTI、VTIQ三者联合的Logistic回归模型分析
Table 3. Logistic regression model analysis of the combination of C-TIRADS, VTI and VTIQ
自变量 β SE Wald P OR 95% CI C-TIRADS 1.198 0.259 21.448 < 0.001 3.314 1.996~5.502 SWVmean 1.402 0.396 12.558 < 0.001 4.063 1.871~8.824 VTI 1.051 0.273 14.822 < 0.001 2.859 1.675~4.881 常量 -10.269 1.554 43.654 < 0.001 < 0.001 SWVmean: 剪切波速度平均值.
下载: 导出CSV
表 4 各联合诊断方法对甲状腺结节的诊断效能
Table 4. Diagnostic efficacy of combined diagnostic methods for thyroid nodules
诊断方法 AUC 95% CI 敏感度(%) 特异度(%) 准确度(%) PPV(%) NPV(%) C-TIRADS+VTIQ+VTI 0.908(0.860~0.944) 91.7 80.2 86.1 87.3 86.7 C-TIRADS+VTIQ 0.865(0.810~0.909) 95.8 64.2 83.1 79.9 91.2 C-TIRADS+VTI 0.874(0.820~0.917) 80.8 80.3 80.6 76.5 93.8
下载: 导出CSV
表 5 C-TIRADS分类、二者联合与三者联合预测模型曲线下面积之间的比较
Table 5. Comparison between C-TIRADS classification, the combination of the two and the three prediction models for the area under the curve
统计值 C-TIRADS与三者联合诊断 C-TIRADS+VTI与三者联合诊断 C-TIRADS+VTIQ与三者联合诊断 Z 3.713 2.262 2.574 P < 0.001 0.024 0.010
下载: 导出CSV
表 6 C-TIRADS与联合诊断方法与病理一致性比较
Table 6. Comparison of the consistency between C-TIRADS and combined diagnostic methods and pathology
诊断方法 Kappa P C-TIRADS 0.619 < 0.001 C-TIRADS+VTI 0.568 < 0.001 C-TIRADS+VTIQ 0.631 < 0.001 C-TIRADS+VTI+VTIQ 0.728 < 0.001
下载: 导出CSV
-
[1] Miller KD, Fidler-Benaoudia M, Keegan TH, et al. Cancer statistics for adolescents and young adults, 2020[J]. CA Cancer J Clin, 2020, 70(6): 443-59. doi: 10.3322/caac.21637 [2] Fagin JA, Wells SA Jr. Biologic and clinical perspectives on thyroid cancer[J]. N Engl J Med, 2016, 375(11): 1054-67. doi: 10.1056/NEJMra1501993 [3] Wong R, Farrell SG, Grossmann M. Thyroid nodules: diagnosis and management[J]. Med J Aust, 2018, 209(2): 92-8. doi: 10.5694/mja17.01204 [4] Malhi HS, Grant EG. Ultrasound of thyroid nodules and the thyroid imaging reporting and data system[J]. Neuroimaging Clin N Am, 2021, 31(3): 285-300. doi: 10.1016/j.nic.2021.04.001 [5] 中华医学会超声医学分会浅表器官和血管学组, 中国甲状腺与乳腺超声人工智能联盟. 2020甲状腺结节超声恶性危险分层中国指南: C-TIRADS[J]. 中华超声影像学杂志, 2021, 30(3): 185-200. doi: 10.3760/cma.j.cn131148-20210205-00092 [6] Wang CY, Li Y, Zhang MM, et al. Analysis of differential diagnosis of benign and malignant partially cystic thyroid nodules based on ultrasound characterization with a TIRADS grade-4a or higher nodules[J]. Front Endocrinol (Lausanne), 2022, 13: 861070. doi: 10.3389/fendo.2022.861070 [7] Gao XQ, Ma Y, Peng XS, et al. Diagnostic performance of C-TIRADS combined with SWE for the diagnosis of thyroid nodules[J]. Front Endocrinol (Lausanne), 2022, 13: 939303. doi: 10.3389/fendo.2022.939303 [8] Zhu TT, Chen JH, Zhou ZM, et al. Differentiation of thyroid nodules (C-TIRADS 4) by combining contrast-enhanced ultrasound diagnosis model with Chinese thyroid imaging reporting and data system[J]. Front Oncol, 2022, 12: 840819. doi: 10.3389/fonc.2022.840819 [9] Jin Z, Zhu YQ, Lei Y, et al. Clinical application of C-TIRADS category and contrast-enhanced ultrasound in differential diagnosis of solid thyroid nodules measuring ≥1 cm[J]. Med Sci Monit, 2022, 28: e936368. [10] Dória MT, Jales RM, Conz L, et al. Diagnostic accuracy of shear wave elastography-Virtual touch ™imaging quantification in the evaluation of breast masses: impact on ultrasonography's specificity and its ultimate clinical benefit[J]. Eur J Radiol, 2019, 113: 74-80. doi: 10.1016/j.ejrad.2019.02.004 [11] Wang A, Zhong J, Wang S, et al. Different precompression does not reduce the diagnostic value of virtual touch tissue imaging and quantification (VTIQ) in breast lesions, especially for the ratio of the shear wave velocity between lesions and surrounding tissues[J]. Eur J Radiol, 2022, 151: 110284. doi: 10.1016/j.ejrad.2022.110284 [12] 李泉水, 徐细洁, 陈胜华, 等. 超声成像结合VTI弹性成像在甲状腺良恶性结节鉴别诊断中的作用[J]. 中国超声医学杂志, 2016, 32(1): 9-12. https://www.cnki.com.cn/Article/CJFDTOTAL-ZGCY201601005.htm [13] 周萍, 詹维伟, 任新平, 等. 超声弹性成像诊断甲状腺结节的价值[J]. 中国医学影像学杂志, 2009, 17(4): 262-5. doi: 10.3969/j.issn.1005-5185.2009.04.007 [14] Hu Y, Xu SY, Zhan WW. Diagnostic performance of C-TIRADS in malignancy risk stratification of thyroid nodules: a systematic review and meta-analysis[J]. Front Endocrinol (Lausanne), 2022, 13: 938961. doi: 10.3389/fendo.2022.938961 [15] 高源, 邓大同, 刘彧, 等. 2020版C-TIRADS在甲状腺结节诊断和处理中的应用价值[J]. 安徽医科大学学报, 2022, 57(3): 497-9. https://www.cnki.com.cn/Article/CJFDTOTAL-YIKE202203031.htm [16] Cheng H, Zhuo SS, Rong X, et al. Value of contrast-enhanced ultrasound in adjusting the classification of Chinese-TIRADS 4 nodules[J]. Int J Endocrinol, 2022, 2022: 5623919. [17] Qi Q, Zhou AY, Guo SP, et al. Explore the diagnostic efficiency of Chinese thyroid imaging reporting and data systems by comparing with the other four systems (ACR TI-RADS, kWak-TIRADS, KSThR-TIRADS, and EU-TIRADS): a single-center study[J]. Front Endocrinol (Lausanne), 2021, 12: 763897. doi: 10.3389/fendo.2021.763897 [18] Mao S, Zhao LP, Li XH, et al. The diagnostic performance of 2020 Chinese Ultrasound Thyroid Imaging Reporting and Data System in thyroid nodules[J]. Zhonghua Yi Xue Za Zhi, 2021, 101(45): 3748-53. [19] Chen QF, Lin MN, Wu SZ. Validating and comparing C-TIRADS, K-TIRADS and ACR-TIRADS in stratifying the malignancy risk of thyroid nodules[J]. Front Endocrinol (Lausanne), 2022, 13: 899575. doi: 10.3389/fendo.2022.899575 [20] 李东旭, 陈琪, 刘千琪, 等. 声辐射力脉冲成像技术联合ACR-TIRADS分类鉴别合并桥本甲状腺炎的结节良恶性的应用[J]. 中国超声医学杂志, 2019, 35(11): 961-4. doi: 10.3969/j.issn.1002-0101.2019.11.001 [21] 童瑾, 黄磊, 李军, 等. 声触诊组织量化成像联合超声造影鉴别诊断TI-RADS 4类良恶性甲状腺结节[J]. 中国医学影像技术, 2020, 36(6): 828-33. https://www.cnki.com.cn/Article/CJFDTOTAL-ZYXX202006008.htm [22] 孙智音. 声脉冲弹性成像(ARFI)中VTQ、VTIQ及CEUS在甲状腺TI-RADS 4级结节中的鉴别诊断价值[J]. 现代肿瘤医学, 2022, 30(19): 3571-6. doi: 10.3969/j.issn.1672-4992.2022.19.025 [23] 林蔚, 丁宁, 朱思平. C-TIRADS联合弹性成像对甲状腺结节良恶性预测的应用价值[J]. 南京医科大学学报: 自然科学版, 2021, 41(9): 1388-91. https://www.cnki.com.cn/Article/CJFDTOTAL-NJYK202109020.htm -


 点击查看大图
计量
- 文章访问数: 155
- HTML全文浏览量: 87
- PDF下载量: 3
- 被引次数: 0