


Correlation between O6 -methylgua-nine-DNA methyltransferase expression and CT imaging and clinicopathological features of esophageal squamous cell carcinoma
-
摘要:
目的探讨食管鳞状细胞癌O6-甲基鸟嘌呤DNA甲基转移酶(MGMT)表达与CT影像及临床病理特征之间的关系。 方法回顾性分析142例手术切除的食管鳞状细胞癌术前胸部平扫及增强CT图像,测量病灶CT值、轴位最大厚度及垂直径,记录临床病理特征。分类资料采用χ2检验或Fisher精确检验。采用独立样本t检验或Mann-Whitney U检验用于比较MGMT不同表达状态间CT参数的差异。采用ROC曲线分析CT参数在预测MGMT不同表达状态时的效能,Spearman分析MGMT表达与CT参数间的相关性。 结果病理总分期、增强CT及∆CT、最大厚度在MGMT不同表达状态组间差异有统计学意义(P均 < 0.05)。增强CT及∆CT鉴别MGMT不同表达状态时的诊断效能较优,曲线下面积分别为0.810、0.817,且增强CT及∆CT与MGMT表达的相关性较高(r=-0.444、-0.473,P 均 < 0.05)。 结论MGMT异常表达可能参与食管鳞状细胞癌的发生与发展过程,术前肿瘤增强CT及∆CT值可较好的预测MGMT表达状态,对评估肿瘤发展及选择合适的治疗方案具有一定临床辅助价值。 -
关键词:
- 食管肿瘤 /
- 食管鳞状细胞癌O6-甲基鸟嘌呤DNA甲基转移酶 /
- 体层摄影术 /
- X线计算机
Abstract:ObjectiveTo investigate the correlation between O6- methylgua-nine-DNA methyltransferase (MGMT) expression and CT imaging, clinicopathological features of esophageal squamous cell carcinoma (ESCC). MethodsNon-enhanced and enhanced thoracic CT images of 142 cases for ESCC were retrospectively analyzed preoperatively. CT values, maximum axial thickness and vertical diameter of lesions were measured, and clinicopathological features were recorded. Categorical variable was tested using the χ2 test or Fisher's exact test. Independent-samples t test or Mann-Whitney U test was applied to compare the differences in CT parameters between different MGMT expression status. Receiver operating characteristic (ROC) curve was used to analyze the effectiveness of CT parameters in predicting different expression status of MGMT and Spearman was used to analyze the correlation between MGMT expression and CT parameters. ResultsThere were significant differences in total pathological stage, enhanced CT, ∆ CT and maximum thickness among different MGMT expression groups (all P < 0.05). The diagnostic efficiency of enhanced CT and ∆CT values in differentiating different expression states of MGMT was higher, with AUC of 0.810, 0.817, respectively. There was a high correlation between the enhanced CT, ∆ CT values and MGMT expression (r=- 0.444, - 0.473, P < 0.05). ConclusionAbnormal expression of MGMT may be involved in the development and progression of ESCC. Preoperative tumor enhanced CT values can better predict the expression status of MGMT, which has auxiliary value for evaluating development of tumor and selecting appropriate treatment scheme. -
Key words:
- esophageal neoplasms /
- MGMT /
- tomography /
- X-ray computed
-

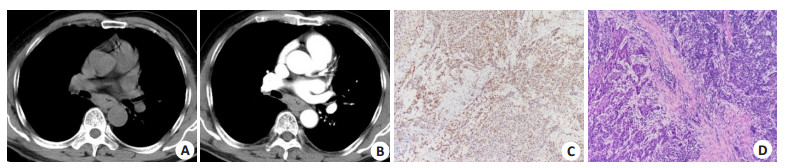
图 1 ESCC的典型CT图像及MGMT表达
Figure 1. Representative CT images and MGMT expression of ESCC.
A: Non-enhanced thoracic CT images showed esophageal wall thickening with lumen stenosis; B: The lesions showed mild enhancement after enhancement; C: MGMT is positively expressed in ESCC (++); D: Pathological examination (HE, original magnification: ×100) confirmed the ESCC.

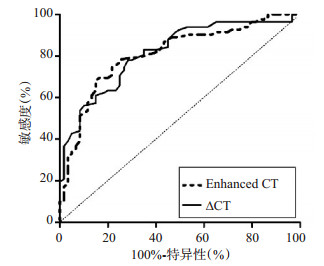
图 2 在高、低MGMT表达的诊断鉴别中的增强CT和△CT值ROC曲线
Figure 2. ROC curves of enhanced CT and ∆ CT value in the differential diagnosis of high and low MGMT expression.
表 1 不同状态下的MGMT表达与临床病理特征的关系
Table 1. The relationship between different status of MGMT expression and clinicopathological characteristics [n(%)]
Clinicopathological characteristics Negative Positive χ2 P Low expression High expression χ2 P Gender 0.701 0.403 0.079 0.778 Man 22(15.49) 90(63.80) 64(45.07) 48(33.80) Female 8(5.63) 22(15.49) 18(12.68) 12 (8.45) Age (year) 1.073 0.590 1.223 0.743 < 60 9(6.34) 26(18.31) 22(15.49) 13 (9.15) ≥60 21(14.79) 86(60.56) 60(42.25) 47(33.10) Differentiated degree 1.004 0.605 3.017 0.225 Poorly 9(6.34) 41(28.87) 24(16.90) 26(18.31) Moderately 14 (9.86) 53(37.32) 42(29.58) 25(17.61) Well 7(4.93) 18(12.68) 16(11.27) 9(6.34) T stage 4.831 0.167 4.935 0.144 T1 3(2.11) 16(11.27) 7(4.93) 12 (8.45) T2 7(4.93) 39(27.46) 26(18.31) 20(14.08) T3 19(13.38) 57(40.14) 48(33.80) 28(19.72) T4 1(0.70) 0(0.00) 1(0.70) 0(0.00) N stage 7.005 0.055 3.837 0.273 N0 14 (9.86) 68(47.89) 43(30.28) 39(27.46) N1 9(6.34) 33(23.24) 25(17.61) 17(11.97) N2 4(2.82) 10
(7.04)11
(7.75)3(2.11) N3 3(2.11) 1(0.70) 3(2.11) 1(0.70) Total pathological stage 4.349 0.195 9.540 0.015 Ⅰ 3(2.11) 21(14.79) 8(5.63) 16(11.27) Ⅱ 12 (8.45) 55(38.73) 38(26.76) 29(20.42) Ⅲ 14 (9.86) 35(24.65) 34(23.94) 15(10.56) Ⅳ 1(0.70) 1(0.70) 2(1.41) 0(0.00)  下载: 导出CSV
表 2 不同状态下的MGMT表达与CT图像特征的关系
Table 2. The relationship between different status of MGMT expression and CT image features
Parameters Negative Positive t/Z P Low expression High expression t/Z P Non-enhanced CT (Hu) 33.04±2.35 36.91±1.15 -1.525 0.191 38.00(15.00) 36.50(19.00) -0.221 0.825 Enhanced CT (Hu) 80.63±3.34 67.05±1.92 3.312 0.001 78.79±2.07 57.80±2.15 6.909 < 0.001 ∆CT (Hu) 45.75(27.00) 27.50(28.00) -6.435 < 0.001 43.09(26.00) 20.00(23.00) -6.435 < 0.001 Maximum thickness (cm) 1.89(1.33) 1.60(1.23) -2.559 0.105 1.90(1.58) 1.42(1.04) -2.559 0.011 Vertical diameter (cm) 1.32(1.14) 1.46(0.68) -1.082 0.879 1.49(0.78) 1.43(0.79) -1.082 0.279
下载: 导出CSV
表 3 CT成像对MGMT不同表达状态的诊断价值
Table 3. Diagnostic efficacy of CT imaging in differentiating different status of MGMT expression
Parameters Cutoff AUC Sensitivity (%) Specificity (%) Accuracy (%) P Negative vs positive Enhanced CT 在66.5 0.704 53.6 86.7 60.59 < 0.001 ACT 在31 0.743 57.1 83.3 62.64 < 0.001 Low expression vshigh expression Enhanced CT 在70.5 0.810 85.0 68.3 75.37 < 0.001 ACT 在28 0.817 71.7 78.0 75.34 < 0.001 Maximum thickness 在1.6 0.626 60.0 63.4 61.96 0.007 AUC: 曲线下面积.
下载: 导出CSV
-
[1] Torre LA, Bray F, Siegel RL, et al. Global cancer statistics, 2012[J]. CA: A Cancer J Clin, 2015, 65(2): . [2] Chen WQ, Sun KX, Zheng RS, et al. Cancer incidence and mortality in China, 2014[J]. Chin J Cancer Res, 2018, 30(1): 1-12. doi: 10.21147/j.issn.1000-9604.2018.01.01 [3] Ma K, Cao BP, Guo MZ. The detective, prognostic, and predictive value of DNA methylation in human esophageal squamous cell carcinoma[J]. Clin Epigenetics, 2016, 8: 43. doi: 10.1186/s13148-016-0210-9 [4] Saikia S, Rehman AU, Barooah P, et al. Alteration in the expression of MGMT and RUNX3 due to non- CpG promoter methylation and their correlation with different risk factors in esophageal cancer patients[J]. Tumour Biol, 2017, 39(5): 1010428317701630. http://www.ncbi.nlm.nih.gov/pubmed/28468586 [5] Zhang Y, Tong T. Clinical significance of O-6-methylguanine-DNA-methyltransferase promoter methylation in patients with esophageal carcinoma: a systematic meta-analysis[J]. Dig Dis, 2018, 36(2): 89-97. doi: 10.1159/000481342 [6] Hasina R, Surati M, Kawada I, et al. O-6-methylguanine-deoxyribonucleic acid methyltransferase methylation enhances response to temozolomide treatment in esophageal cancer[J]. J Carcinog, 2013, 12: 20. doi: 10.4103/1477-3163.120632 [7] Moon WJ, Choi JW, Roh HG, et al. Imaging parameters of high grade gliomas in relation to the MGMT promoter methylation status: the CT, diffusion tensor imaging, and perfusion MR imaging[J]. Neuroradiology, 2012, 54(6): 555-63. doi: 10.1007/s00234-011-0947-y [8] 李飞, 宋媛, 申远, 等. B3型胸腺瘤和胸腺癌中MGMT蛋白表达缺失的意义及预后分析[J]. 解放军医药杂志, 2018, 30(11): 24-7. doi: 10.3969/j.issn.2095-140X.2018.11.006 [9] 左频, 陈芸, 罗林, 等. 恶性脑胶质瘤患者MGMT基因启动子甲基化状态与预后相关性[J]. 中华肿瘤防治杂志, 2019, 26(1): 24-30. https://www.cnki.com.cn/Article/CJFDTOTAL-QLZL201901006.htm [10] 钱小英, 林海锋, 周安喜, 等. 乳腺癌组织中GSTP1和BRCA1及MGMT基因甲基化状态及其与临床病理特征的关系研究[J]. 中国全科医学, 2018, 21(24): 2952-6. doi: 10.12114/j.issn.1007-9572.2018.00.141 [11] Yin D, Xu Y, Zhen YJ, et al. Relationship between the methylation of folic acid metabolism-related genes and the incidence and prognosis of esophageal cancer among ethnic kazakhs[J]. J Cancer, 2018, 9 (16): 2865-75. doi: 10.7150/jca.25270 [12] Li SH, Rau KM, Lu HI, et al. Pre- treatment maximal oesophageal wall thickness is independently associated with response to chemoradiotherapy in patients with T3-4 oesophageal squamous cell carcinoma[J]. Eur J Cardiothorac Surg, 2012, 42(6): 958-64. doi: 10.1093/ejcts/ezs136 [13] 邢媛媛, 曹宏伟, 仇恒志, 等. 食管癌CD34和VEGF表达与CT强化幅度的关系[J]. 中华肿瘤防治杂志, 2016, 23(S2): 120-1. https://www.cnki.com.cn/Article/CJFDTOTAL-QLZL2016S2059.htm [14] Wongwaiyut K, Ruangsin S, Laohawiriyakamol S, et al. Pretreatment esophageal wall thickness associated with response to chemoradiotherapy in locally advanced esophageal cancer[J]. J Gastrointest Cancer, 2020, 51(3): 947-51. doi: 10.1007/s12029-019-00337-3 [15] 陈垦, 杨世平, 王聪, 等. 多层螺旋CT对食管癌患者术前分期诊断及预后的评估价值研究[J]. 实用医院临床杂志, 2019, 16(5): 157-60. doi: 10.3969/j.issn.1672-6170.2019.05.047 [16] Rehman AU, Saikia S, Iqbal MA, et al. Decreased expression of MGMT in correlation with aberrant DNA methylation in esophageal cancer patients from North India[J]. Tumour Biol, 2017, 39(6): 101042831770577. doi: 10.1177/1010428317705770 [17] 况丽平, 吴名耀, 吴贤英. 食管癌组织中PTEN与MGMT基因蛋白的表达[J]. 中华肿瘤防治杂志, 2007, 14(1): 31-4. doi: 10.3969/j.issn.1673-5269.2007.01.009 [18] 陆国文, 章懿欣, 夏旻明. 胃癌MGMT基因启动子甲基化状态与患者临床预后的关系[J]. 现代实用医学, 2015, 27(6): 745-6, 754. doi: 10.3969/j.issn.1671-0800.2015.06.026 [19] Zhang Z, Xin S, Gao M, et al. Promoter hypermethylation of MGMT gene may contribute to the pathogenesis of gastric cancer: a PRISMA-compliant meta-analysis[J]. Medicine (Madr), 2017, 96 (17): e6708. http://www.ncbi.nlm.nih.gov/pubmed/28445279 [20] Shalaby SM, El-Shal AS, Abdelaziz LA, et al. Promoter methylation and expression of DNA repair genes MGMT and ERCC1 in tissue and blood of rectal cancer patients[J]. Gene, 2018, 644: 66-73. doi: 10.1016/j.gene.2017.10.056 [21] Alizadeh Naini M, Kavousipour S, Hasanzarini M, et al. O6-methyguanine-DNA methyl transferase (MGMT) promoter methylation in serum DNA of Iranian patients withColorectal cancer[J]. Asian Pac J Cancer Prev, 2018, 19(5): 1223-7. http://europepmc.org/articles/PMC6031839/ [22] 皇秋莎, 石雪迎. 胰腺神经内分泌肿瘤中MGMT的研究进展[J]. 临床与实验病理学杂志, 2018, 34(2): 194-7. https://www.cnki.com.cn/Article/CJFDTOTAL-LSBL201802022.htm [23] Das M, Sharma SK, Sekhon GS, et al. Promoter methylation of MGMT gene in serum of patients with esophageal squamous cell carcinoma in North East India[J]. Asian Pac J Cancer Prev, 2014, 15 (22): 9955-60. doi: 10.7314/APJCP.2014.15.22.9955 [24] Baumann S, Keller G, Pühringer F, et al. The prognostic impact ofO6-Methylguanine- DNA Methyltransferase (MGMT) promotor hypermethylation in esophageal adenocarcinoma[J]. Int J Cancer, 2006, 119(2): 264-8. doi: 10.1002/ijc.21848 -

 点击查看大图
计量
- 文章访问数: 326
- HTML全文浏览量: 213
- PDF下载量: 5
- 被引次数: 0