


Predictive value of left atrial mechanical dispersion measured by ultrasound strain imaging for new-onset atrial fibrillation
-
摘要:
目的 应用超声应变成像定量评估左房机械离散度与新发房颤的关系,探讨其预测房颤在左房扩大及左房功能障碍之外的增量价值。 方法 选取2018~2021年有房颤风险的376例一般人群作为受试者行心电图检查,随访3年后选取有新发房颤的35例受试者作为研究组,在同一队列中选取与研究组相等例数且年龄性别相匹配的未出现房颤受试者作为对照组。应用超声应变成像测量两组的12节段左房应变值,获取并分析两组的左房容积指数(LAVI)、左房泵应变(LAPS)、左房储器应变(LARS)及左房机械离散度(SD-TPS)的差异性。SD-TPS定义为经R-R间期标化的左房各节段储器应变达峰时间标准差。校正患者基线资料、LAVI、LAPS、LARS,分析SD-TPS与新发房颤的独立相关性及其增量预测价值。 结果 两组LAVI的差异无统计学意义(32.5±9.2 mL/m2 vs 29.5±8.3 mL/m2,P=0.16);研究组的LAPS[(16.6±4.3)% vs (20.6±4.3)%,P < 0.01]和LARS[(31.4±7.7)% vs(38.0±7.3)%,P < 0.01]低于对照组;研究组的SD-TPS高于对照组([6.3±2.3)% vs (3.9±1.6)%,P < 0.01]。调整了CHARGE-AF评分、LAVI和LARS后,SD-TPS仍与新发房颤独立相关(危险比1.26,95%CI=1.10-1.45,P < 0.01)。Cox比例风险回归模型中,SDTPS预测新发房颤可提供左房容积及左房应变之外的增量价值(P < 0.01)。 结论 从超声应变成像中获得的左房机械离散度可作为新发房颤风险分层的有效预测指标,在预测新发房颤方面可提供左房容积及左房功能障碍之外的增量价值。 Abstract:Objective To evaluate the relationship between left atrial mechanical dispersion and new-onset atrial fibrillation by using ultrasonic strain imaging, and its incremental value in predicting atrial fibrillation beyond left atrial enlargement and left atrial dysfunction was discussed. Methods A total of 376 general population at risk of atrial fibrillation were examined by electrocardiogram from 2018-2021. After 3 years of follow-up, 35 subjects with new-onset atrial fibrillation were selected as the study group. In the same cohort, subjects without atrial fibrillation who had the same number of cases as the study group and matched with age and sex were selected as the control group. Ultrasound strain imaging was applied to measure 12-segment left atrial strain values in both groups. The differences of left atrial volume index (LAVI), left atrial pump strain (LAPS), left atrial reservoir strain (LARS), and left atrial mechanical dispersion (SD-TPS) between the two groups were obtained and analyzed. SD-TPS was defined as the standard deviation of peak time of reservoir strain in each segment of left atrial standardized by R-R interval. The baseline data, LAVI, LAPS and LARS were adjusted. The independent correlation between SD-TPS and new-onset atrial fibrillation, and its incremental predictive value were analyzed. Results There was no significant difference in left atrial volume index (32.5±9.2 mL/m2 vs 29.5±8.3 mL/m2, P=0.16). Patients with new-onset atrial fibrillation had significantly worse left atrial pump strain [(16.6±4.3)% vs (20.6±4.3)%, P < 0.01)and reservoir strain[(31.4±7.7)% vs (38.0±7.3)%, P < 0.01)than those without atrial fibrillation. SD-TPS was significantly higher in patients with atrial fibrillation than in those without it[(6.3 ± 2.3)% vs (3.9 ± 1.6)%, P < 0.01). SD-TPS was independently associated with new-onset atrial fibrillation after adjustment for CHARGE-AF score, LAVI and LARS (hazard ratio=1.26, 95%CI: 1.10-1.45, P < 0.01). In the nested Cox models, the model based on the left atrial volume and strain for predicting new onset atrial fibrillation was significantly improved by adding SD-TPS (P < 0.01). Conclusion The left atrial mechanical dispersion obtained from ultrasound strain imaging can be used as an effective predictor of risk stratification of new-onset atrial fibrillation. It can provide incremental value beyond left atrial volume and left atrial dysfunction in predicting new-onset atrial fibrillation. -
Key words:
- atrial fibrillation /
- echocardiography /
- strain /
- dispersion /
- left atrium
-

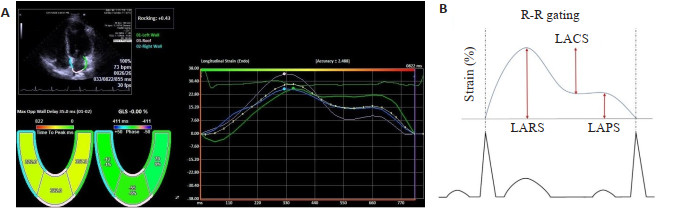
图 1 左房应变参数的测量
A:左房各节段应变曲线及应变达峰时间;B:左房应变分量示意图.
Figure 1. Measurement of left atrial strain parameters.

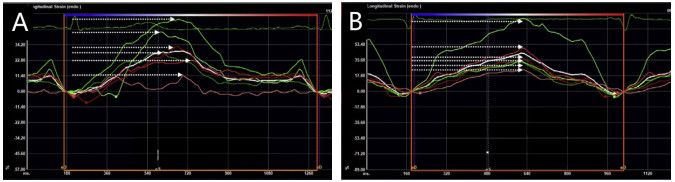
图 2 两组代表性案例的左房应变曲线和SD-TPS
A:房颤患者,SD-TPS=6.3%;B:非房颤患者,SD-TPS=2.3%.
Figure 2. Measurements of left atrium dispersion and representative cases in patients with and without AF

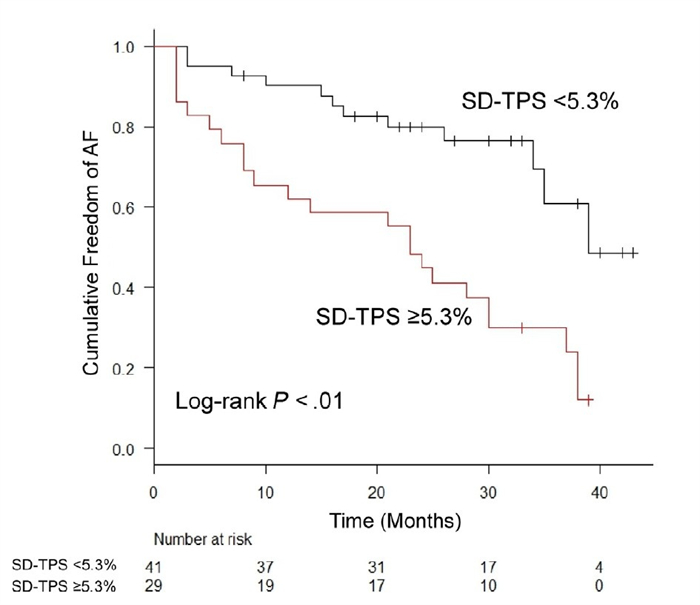
图 3 新发房颤的生存曲线分析(SD-TPS=5.3%)
Figure 3. Kaplan-Meier curves showing freedom from new-onset atrial fibrillation (SD-TPS=5.3%).
表 1 患者基线特征
Table 1. Patient baseline characteristics
项目 所有患者(n=70) 研究组(n=35) 对照组(n=35) P 年龄(岁,Mean±SD) 70±4 70±4 70±4 - 性別[男,n(%)] 40(57) 20(57) 20(57) - 体表面积(m2,Mean±SD) 1.9±0.2 2.0±0.2 1.9±0.2 0.82 BMI (kg/m2, Mean±SD) 29.5±4.6 29.7±5.0 29.4±4.3 0.79 肥胖[n(%)] 3(44) 14(40) 17(49) 0.47 2型糖尿病[n(%)] 34(49) 18(51) 16(46) 0.73 高脂血症[n(%)] 32(48) 15(45) 17(49) 0.71 高血压[n(%)] 53(76) 27(77) 26(74) 0.78 CHA2DS2-VASc评分(Mean±SD) 3.0±1.0 3.1±0.9 3.0±1.0 0.71 CHARGE-AF评分 8.3(5.0, 12.7) 6.9(5.1, 12.2) 8.7(4.8, 14) 0.49 用药情况[n(%)] ACEI或ARBs 44(63) 20(57) 24(69) 0.32 b受体阻滞剂 7(10) 5(14) 2(6) 0.43 钙桔抗剂 16(23) 5(14) 11(37) 0.06 降血脂药 33(47) 15(43) 18(51) 0.30 抗血小板药 19(27) 9(26) 10(29) 0.66 超声心动图参数(Mean±SD) LVEF(%) 62.7±6.2 61.3±6.3 64.1±5.8 0.06 GLS(%) -18.5±2.7 -18.1±3.3 -18.8±1.9 0.46 GCS(%) -29.9±5.4 -29.9±5.8 -30.0±5.0 0.94 E/e' 8.9±2.7 8.6±2.6 9.1±2.8 0.44 LAVl(mL/m2) 31.0±8.8 32.5±9.2 29.5±8.3 0.16 LAPS(%) 18.6±4.7 16.6±4.3 20.6±4.3 < 0.01 LACS(%) 16.0±5.2 14.8±4.9 17.1±5.4 0.06 LARS(%) 34.7±8.1 31.4±7.7 38.0±7.3 < 0.01 SD-TPSC%) 5.1±2.3 6.3±2.3 3.9±1.6 < 0.01 LVEF:左室射血分数;GLS:整体纵向应变;GCS:整体圆周应变;E/e’:舒张早期二尖瓣口血流速度/舒张早期二尖瓣瓣环运动速度;LAVI:左房容积指数;LAPS:左房泵应变;LACS:左房管道应变;LARS:左房储器应变;SD-TPS:左房机械离散度(经R-R间期标化的左房各节段储器应变达峰时间标准差)  下载: 导出CSV
表 2 SD-TPS与其他超声心动图参数的线性回归分析
Table 2. Associations of SD-TPS and other echocardiographic parameters
参数 单变量线性回归分析 多变量线性回归分析 非标准系数b 标准系数b P 非标准系数b 标准系数b P LVEF -0.144(-0.227, -0.060) -0.384 < 0.01 -0.101(-0.190, -0.013) -0.271 0.03 GCS 0.036(-0.068, 0.140) 0.083 0.49 GLS 0.292(0.098, 0.486) 0.342 < 0.01 0.118(-0.095, 0.330) 0.138 0.27 E/e' 0.187(-0.015, 0.388) 0.219 0.07 LAVI 0.051(-0.011, 0.114) 0.196 0.10 0.012(-0.050, 0.075) 0.047 0.69 LAPS 0.123(-0.238, -0.007) -0.249 0.04 LARS 0.109(-0.173, -0.046) -0.385 < 0.01 -0.076(-0.147,-0.004) -0.266 0.04
下载: 导出CSV
表 3 SD-TPS与其他超声心动图参数的相关性
Table 3. Correlation between SD-TPS and other echocardiographic parameters
参数 r P LVEF -0.384 < 0.01 GCS 0.083 0.49 GLS 0.342 < 0.01 E/e' 0.219 0.07 LAVI 0.196 0.10 LAPS -0.249 0.04 LARS -0.385 < 0.01
下载: 导出CSV
表 4 新发房颤相关因素的Cox比例风险回归模型分析
Table 4. Univariable and multivariable Cox regression analysis for new-onset atrial fibrillation
因素 单因素 多因素 临床资料模型 药物治疗模型 超声检测模型 HR (95% CI) P HR (95% CI) P HR (95% CI) P HR (95% CI) P BMI 1.00 (0.94~1.07) 0.94 0.96 (0.89~1.04) 0.30 CHA2DS2-VASc评分 1.05 (0.76~1.45) 0.79 0.97 (0.65~1.44) 0.87 CHARGE-AF评分 0.97 (0.90~1.04) 0.41 0.96 (0.88~1.05) 0.35 ACEI或ARBs 1.58(0.81~3.10) 0.18 1.89 (0.85~4.21) 0.12 b受体阻滞剂 0.57 (0.22~1.50) 0.26 0.52 (0.16~1.66) 0.27 钙桔抗剂 1.58(0.61~4.09) 0.35 1.80 (0.67~4.86) 0.25 LVEF 0.96 (0.91~1.01) 0.08 1.02 (0.96~1.08) 0.59 LAVI 1.04(1.00~1.07) 0.04 1.00 (0.95~1.08) 0.88 LARS 0.92 (0.88~0.96) < 0.01 0.93 (0.86~0.99) 0.02 SD-TPS 1.32(1.17~1.50) < 0.01 1.37 (1.20~1.59) < 0.01 1.37(1.21~1.56) < 0.01 1.28 (1.08~1.51) < 0.01
下载: 导出CSV
表 5 LARS与SD-TPS预测新发房颤的增量价值
Table 5. Incremental value of LARS and SD-TPS in predicting new-onset atrial fibrillation
项目 模型1(χ2=5.3) 模型2(χ2=17.8) 模型3(χ2=27.5) HR (95%CI) P HR (95%CI) P HR (95%CI) P CHARGE-AF评分 0.96 (0.90~1.04) 0.33 0.93 (0.86~1.01) 0.07 0.93 (0.85~1.00) 0.06 LAVI 1.04 (1.00~1.07) 0.03 1.00 (0.96~1.04) 0.81 1.00 (0.96~1.05) 0.99 LARS 0.90 (0.85~0.95) < 0.01 0.92 (0.86~0.98) < 0.01 SD-TPS 1.26(1.10~1.45) < 0.01
下载: 导出CSV
表 6 超声心动图参数的ROC曲线分析
Table 6. ROC curve analysis of echocardiographic variables
参数 AUC 95%CI P 截点值(%) 敏感性(%) 特异性(%) 阳性预测值(%) 阴性预测值(%) SD-TPSC%) 0.80 0.69~0.90 < 0.01 5.3 65.7 85.7 82.1 71.4 LARS(%) 0.75 0.63~0.87 < 0.01 36.8 82.9 65.7 70.7 79.3 LVEF(%) 0.62 0.49~0.76 0.08 63.6 71.4 54.3 61.0 65.5 LAVl(mL/m2) 0.59 0.46~0.73 0.18 28.9 62.9 51.4 56.4 58.1 GLS(%) 0.55 0.41~0.69 0.46 17.6 45.7 71.4 61.5 56.8
下载: 导出CSV
-
[1] Hoit BD. Left atrial size and function: role in prognosis[J]. J Am Coll Cardiol, 2014, 63(6): 493-505. doi: 10.1016/j.jacc.2013.10.055 [2] Fatema K, Barnes ME, Bailey KR, et al. Minimum vs. maximum left atrial volume for prediction of first atrial fibrillation or flutter in an elderly cohort: a prospective study[J]. Eur J Echocardiogr, 2009, 10(2): 282-6. [3] Conen D, Glynn RJ, Sandhu RK, et al. Risk factors for incident atrial fibrillation with and without left atrial enlargement in women [J]. Int J Cardiol, 2013, 168(3): 1894-9. doi: 10.1016/j.ijcard.2012.12.060 [4] Hirose T, Kawasaki M, Tanaka R, et al. Left atrial function assessed by speckle tracking echocardiography as a predictor of new-onset non-valvular atrial fibrillation: results from a prospective study in 580 adults[J]. Eur Heart J Cardiovasc Imaging, 2012, 13(3): 243-50. doi: 10.1093/ejechocard/jer251 [5] Haugaa KH, Goebel B, Dahlslett T, et al. Risk assessment of ventricular arrhythmias in patients with nonischemic dilated cardiomyopathy by strain echocardiography[J]. J Am Soc Echocardiogr, 2012, 25(6): 667-73. doi: 10.1016/j.echo.2012.02.004 [6] Ciuffo L, Tao S, Gucuk Ipek E, et al. Intra-atrial dyssynchrony during sinus rhythm predicts recurrence after the first catheter ablation for atrial fibrillation[J]. JACC Cardiovasc Imaging, 2019, 12(2): 310-9. doi: 10.1016/j.jcmg.2017.11.028 [7] 沙雨佳. 左心房应变及机械离散度预测房颤患者射频消融术后复发的研究[D]. 大连: 大连医科大学, 2021. [8] Kim IS, Kim TH, Shim CY, et al. The ratio of early transmitral flow velocity (E) to early mitral annular velocity (Em) predicts improvement in left ventricular systolic and diastolic function 1 year after catheter ablation for atrial fibrillation[J]. Europace, 2015, 17(7): 1051-8. doi: 10.1093/europace/euu346 [9] Hong J, Gu XY, An P, et al. Left atrial functional remodeling in lone atrial fibrillation: a two-dimensional speckle tracking echocardiographic study[J]. Echocardiography, 2013, 30(9): 1051-60. [10] Saraiva RM, Demirkol S, Buakhamsri A, et al. Left atrial strain measured by two-dimensional speckle tracking represents a new tool to evaluate left atrial function[J]. J Am Soc Echocardiogr, 2010, 23(2): 172-80. doi: 10.1016/j.echo.2009.11.003 [11] Cameli M, Lisi M, Righini FM, et al. Novel echocardiographic techniques to assess left atrial size, anatomy and function[J]. Cardiovasc Ultrasound, 2012, 10: 4. doi: 10.1186/1476-7120-10-4 [12] Shang ZJ, Su DC, Cong T, et al. Assessment of left atrial mechanical function and synchrony in paroxysmal atrial fibrillation with two-dimensional speckle tracking echocardiography[J]. Echocardiography, 2017, 34(2): 176-83. doi: 10.1111/echo.13434 [13] Mochizuki A, Yuda S, Oi Y, et al. Assessment of left atrial deformation and synchrony by three-dimensional speckle-tracking echocardiography: comparative studies in healthy subjects and patients with atrial fibrillation[J]. J Am Soc Echocardiogr, 2013, 26 (2): 165-74. doi: 10.1016/j.echo.2012.10.003 [14] Watanabe Y, Nakano Y, Hidaka T, et al. Mechanical and substrate abnormalities of the left atrium assessed by 3-dimensional speckletracking echocardiography and electroanatomic mapping system in patients with paroxysmal atrial fibrillation[J]. Heart Rhythm, 2015, 12(3): 490-7. doi: 10.1016/j.hrthm.2014.12.007 [15] Sarvari SI, Haugaa KH, Stokke TM, et al. Strain echocardiographic assessment of left atrial function predicts recurrence of atrial fibrillation[J]. Eur Heart J Cardiovasc Imaging, 2016, 17(6): 660-7. doi: 10.1093/ehjci/jev185 [16] Hongning Y, Ruiqin X, Jing W, et al. Assessment of left atrial function and dyssynchrony by real time three-dimensional echocardiography predicts recurrence of paroxysmal atrial fibrillation after radiofrequency ablation[J]. Eur Rev Med Pharmacol Sci, 2018, 22(10): 3151-9. [17] Kupczynska K, Michalski BW, Miskowiec D, et al. Incremental value of left atrial mechanical dispersion over CHA 2 DS 2-VASc score in predicting risk of Thrombus formation[J]. Echocardiography, 2018, 35(5): 651-60. doi: 10.1111/echo.13899 [18] Bonapace S, Valbusa F, Bertolini L, et al. Early impairment in left ventricular longitudinal systolic function is associated with an increased risk of incident atrial fibrillation in patients with type 2 diabetes[J]. J Diabetes Complications, 2017, 31(2): 413-8. doi: 10.1016/j.jdiacomp.2016.10.032 [19] Magnani JW, Zhu L, Lopez F, et al. P-wave indices and atrial fibrillation: cross-cohort assessments from the Framingham Heart Study (FHS) and Atherosclerosis Risk in Communities (ARIC) study[J]. Am Heart J, 2015, 169(1): 53-6111. doi: 10.1016/j.ahj.2014.10.009 [20] Schumacher K, Dagres N, Hindricks G, et al. Characteristics of PR interval as predictor for atrial fibrillation: association with biomarkers and outcomes[J]. Clin Res Cardiol, 2017, 106(10): 767-75. doi: 10.1007/s00392-017-1109-y -

 点击查看大图
计量
- 文章访问数: 193
- HTML全文浏览量: 120
- PDF下载量: 10
- 被引次数: 0